The Workouts dashboard gives you an overview of your training activity and progress. It is designed to help you visualize what you’ve completed in your training and let you dive deeper into specifics on muscle groups, exercises, and workouts.
The dashboard is divided into several sections. Each section includes widgets that summarize different types of information you can use to inform your training decisions.
The Weekly Workouts widget appears at the top of the dashboard and provides a snapshot of your current training cycle.
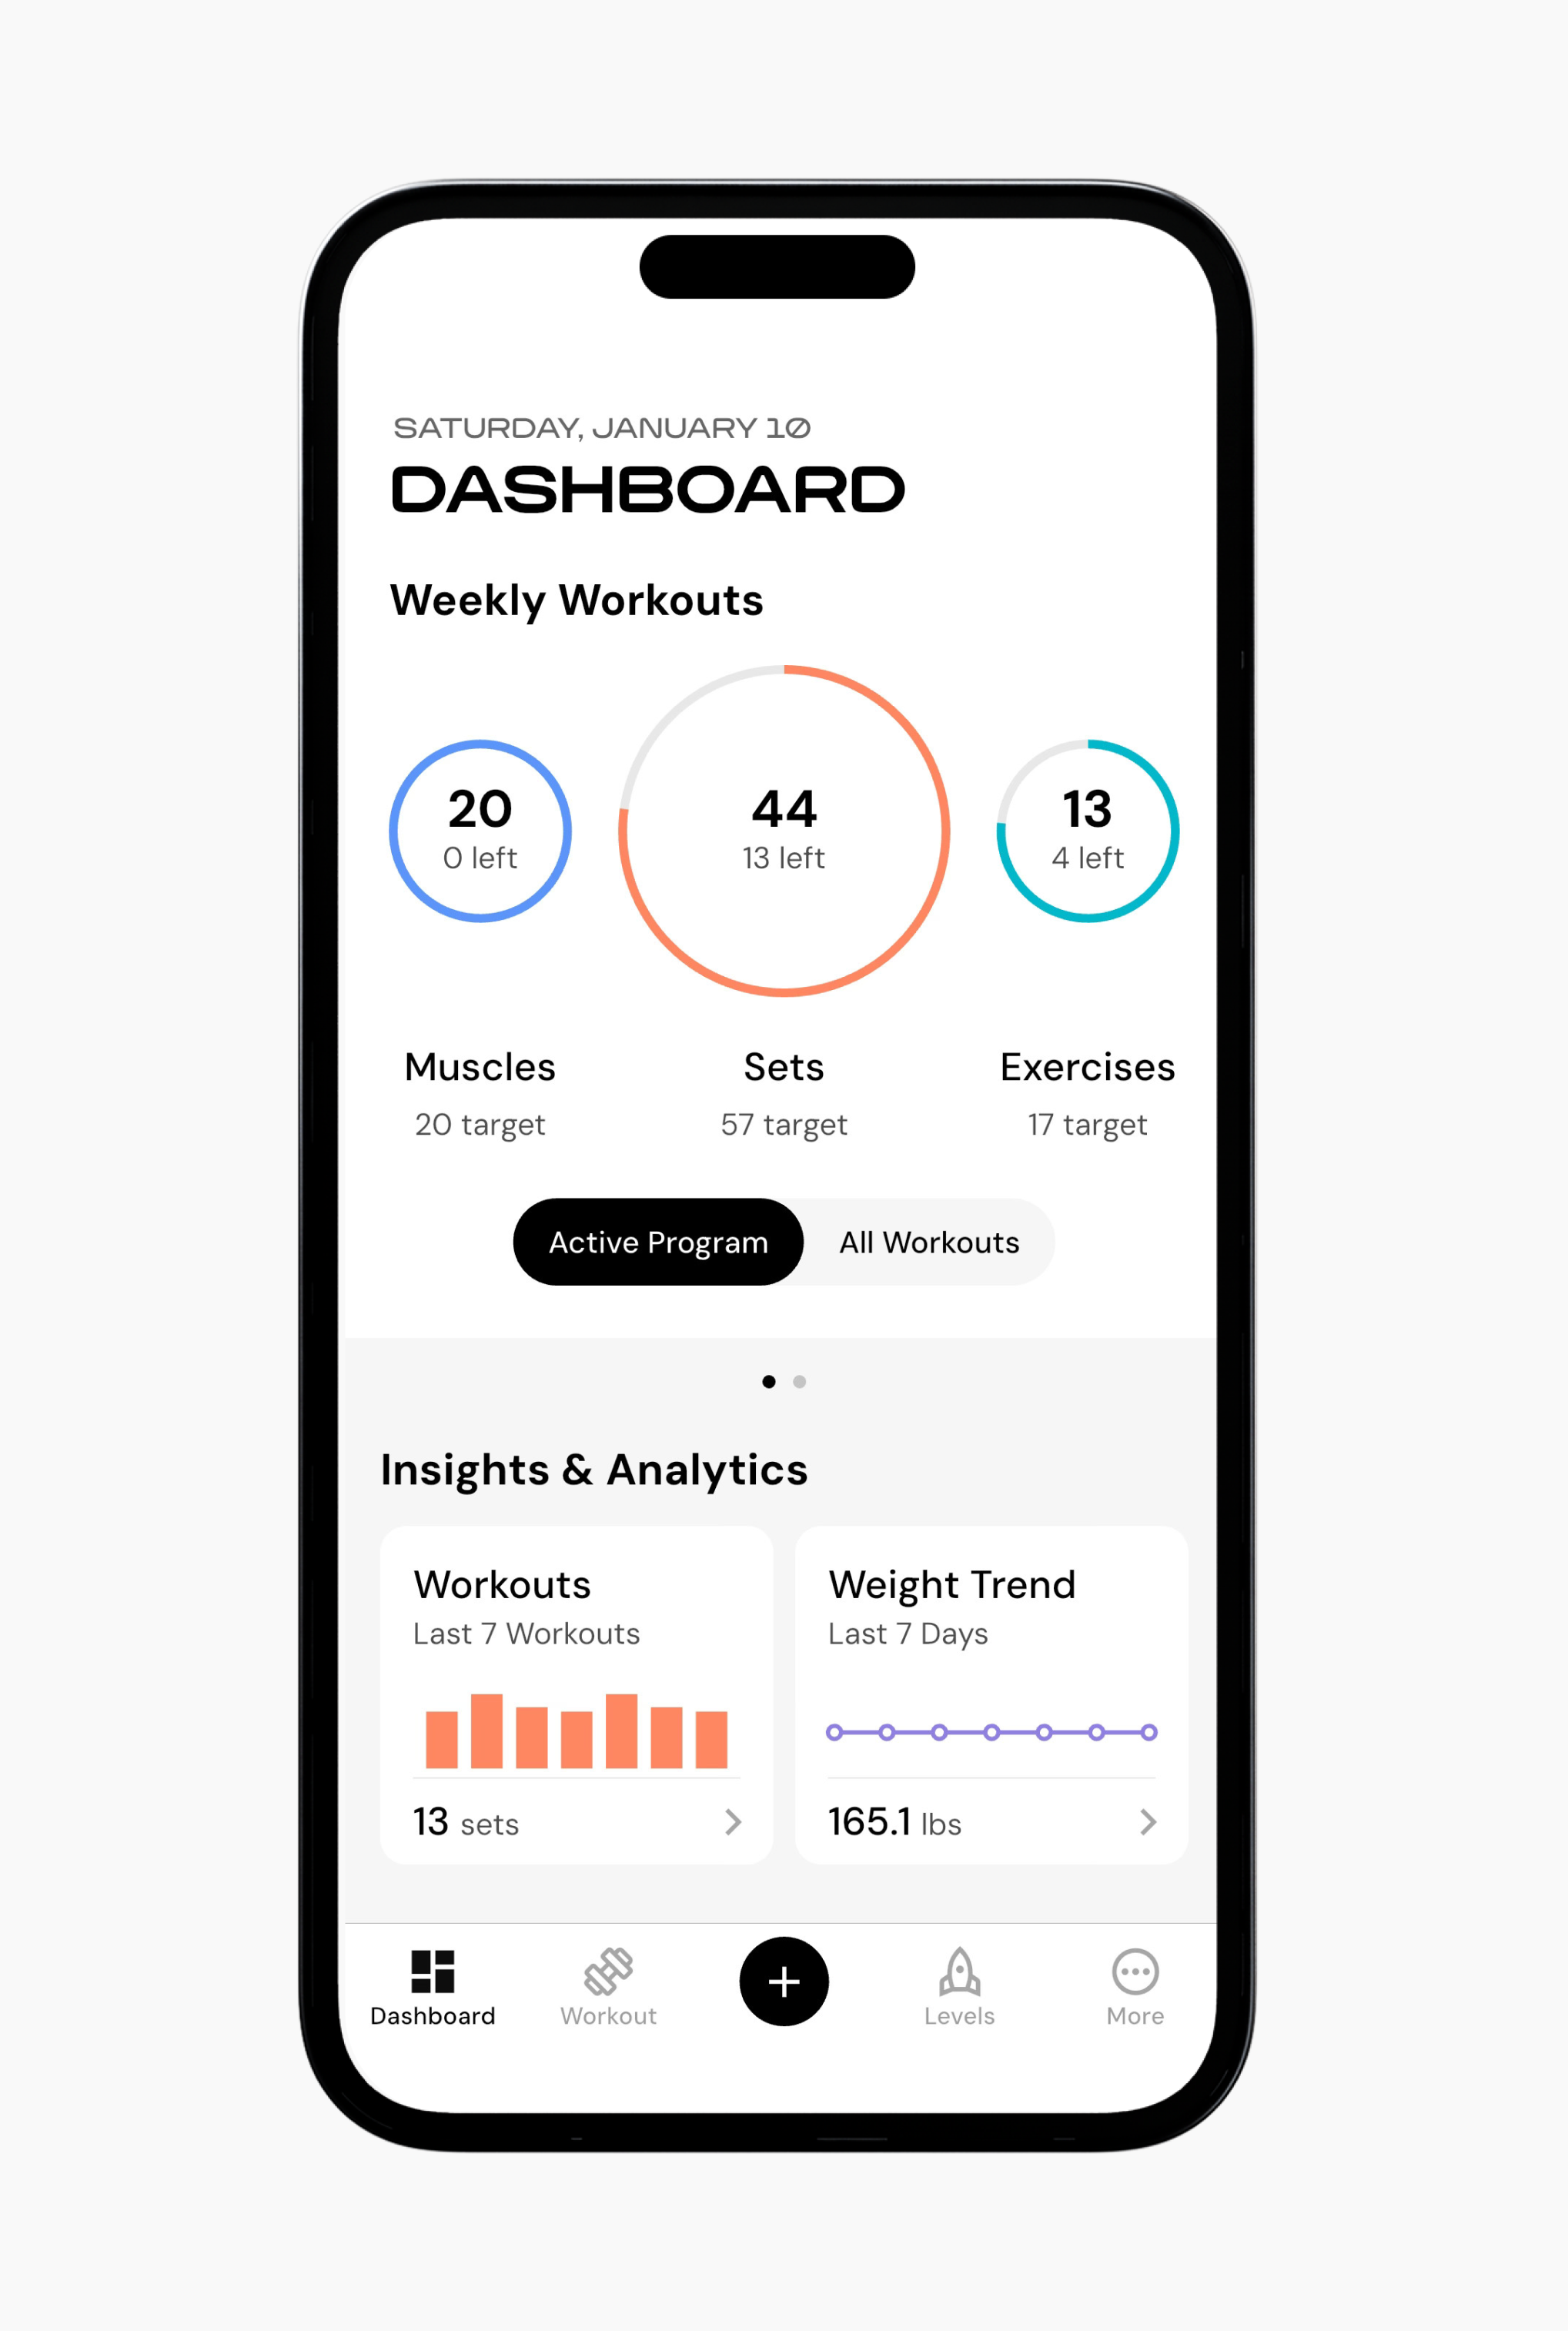
This section shows how much training you’ve completed in three areas:
Muscles: Muscle groups you have trained and how they relate to your weekly targets.
Sets: How many sets you have completed in relation to your weekly targets.
Exercises: How many exercises you have performed in relation to your weekly targets.
Your rings will fill as you log your training, giving you an immediate view of your current progress.
You can also toggle between your current and previous cycles to compare progress.
Lastly, if you swipe left within this widget, you can view your recent records for volume, reps, and estimated 1-RM.
The Recent Records section shows your recent performances across training sessions in multiple record types.
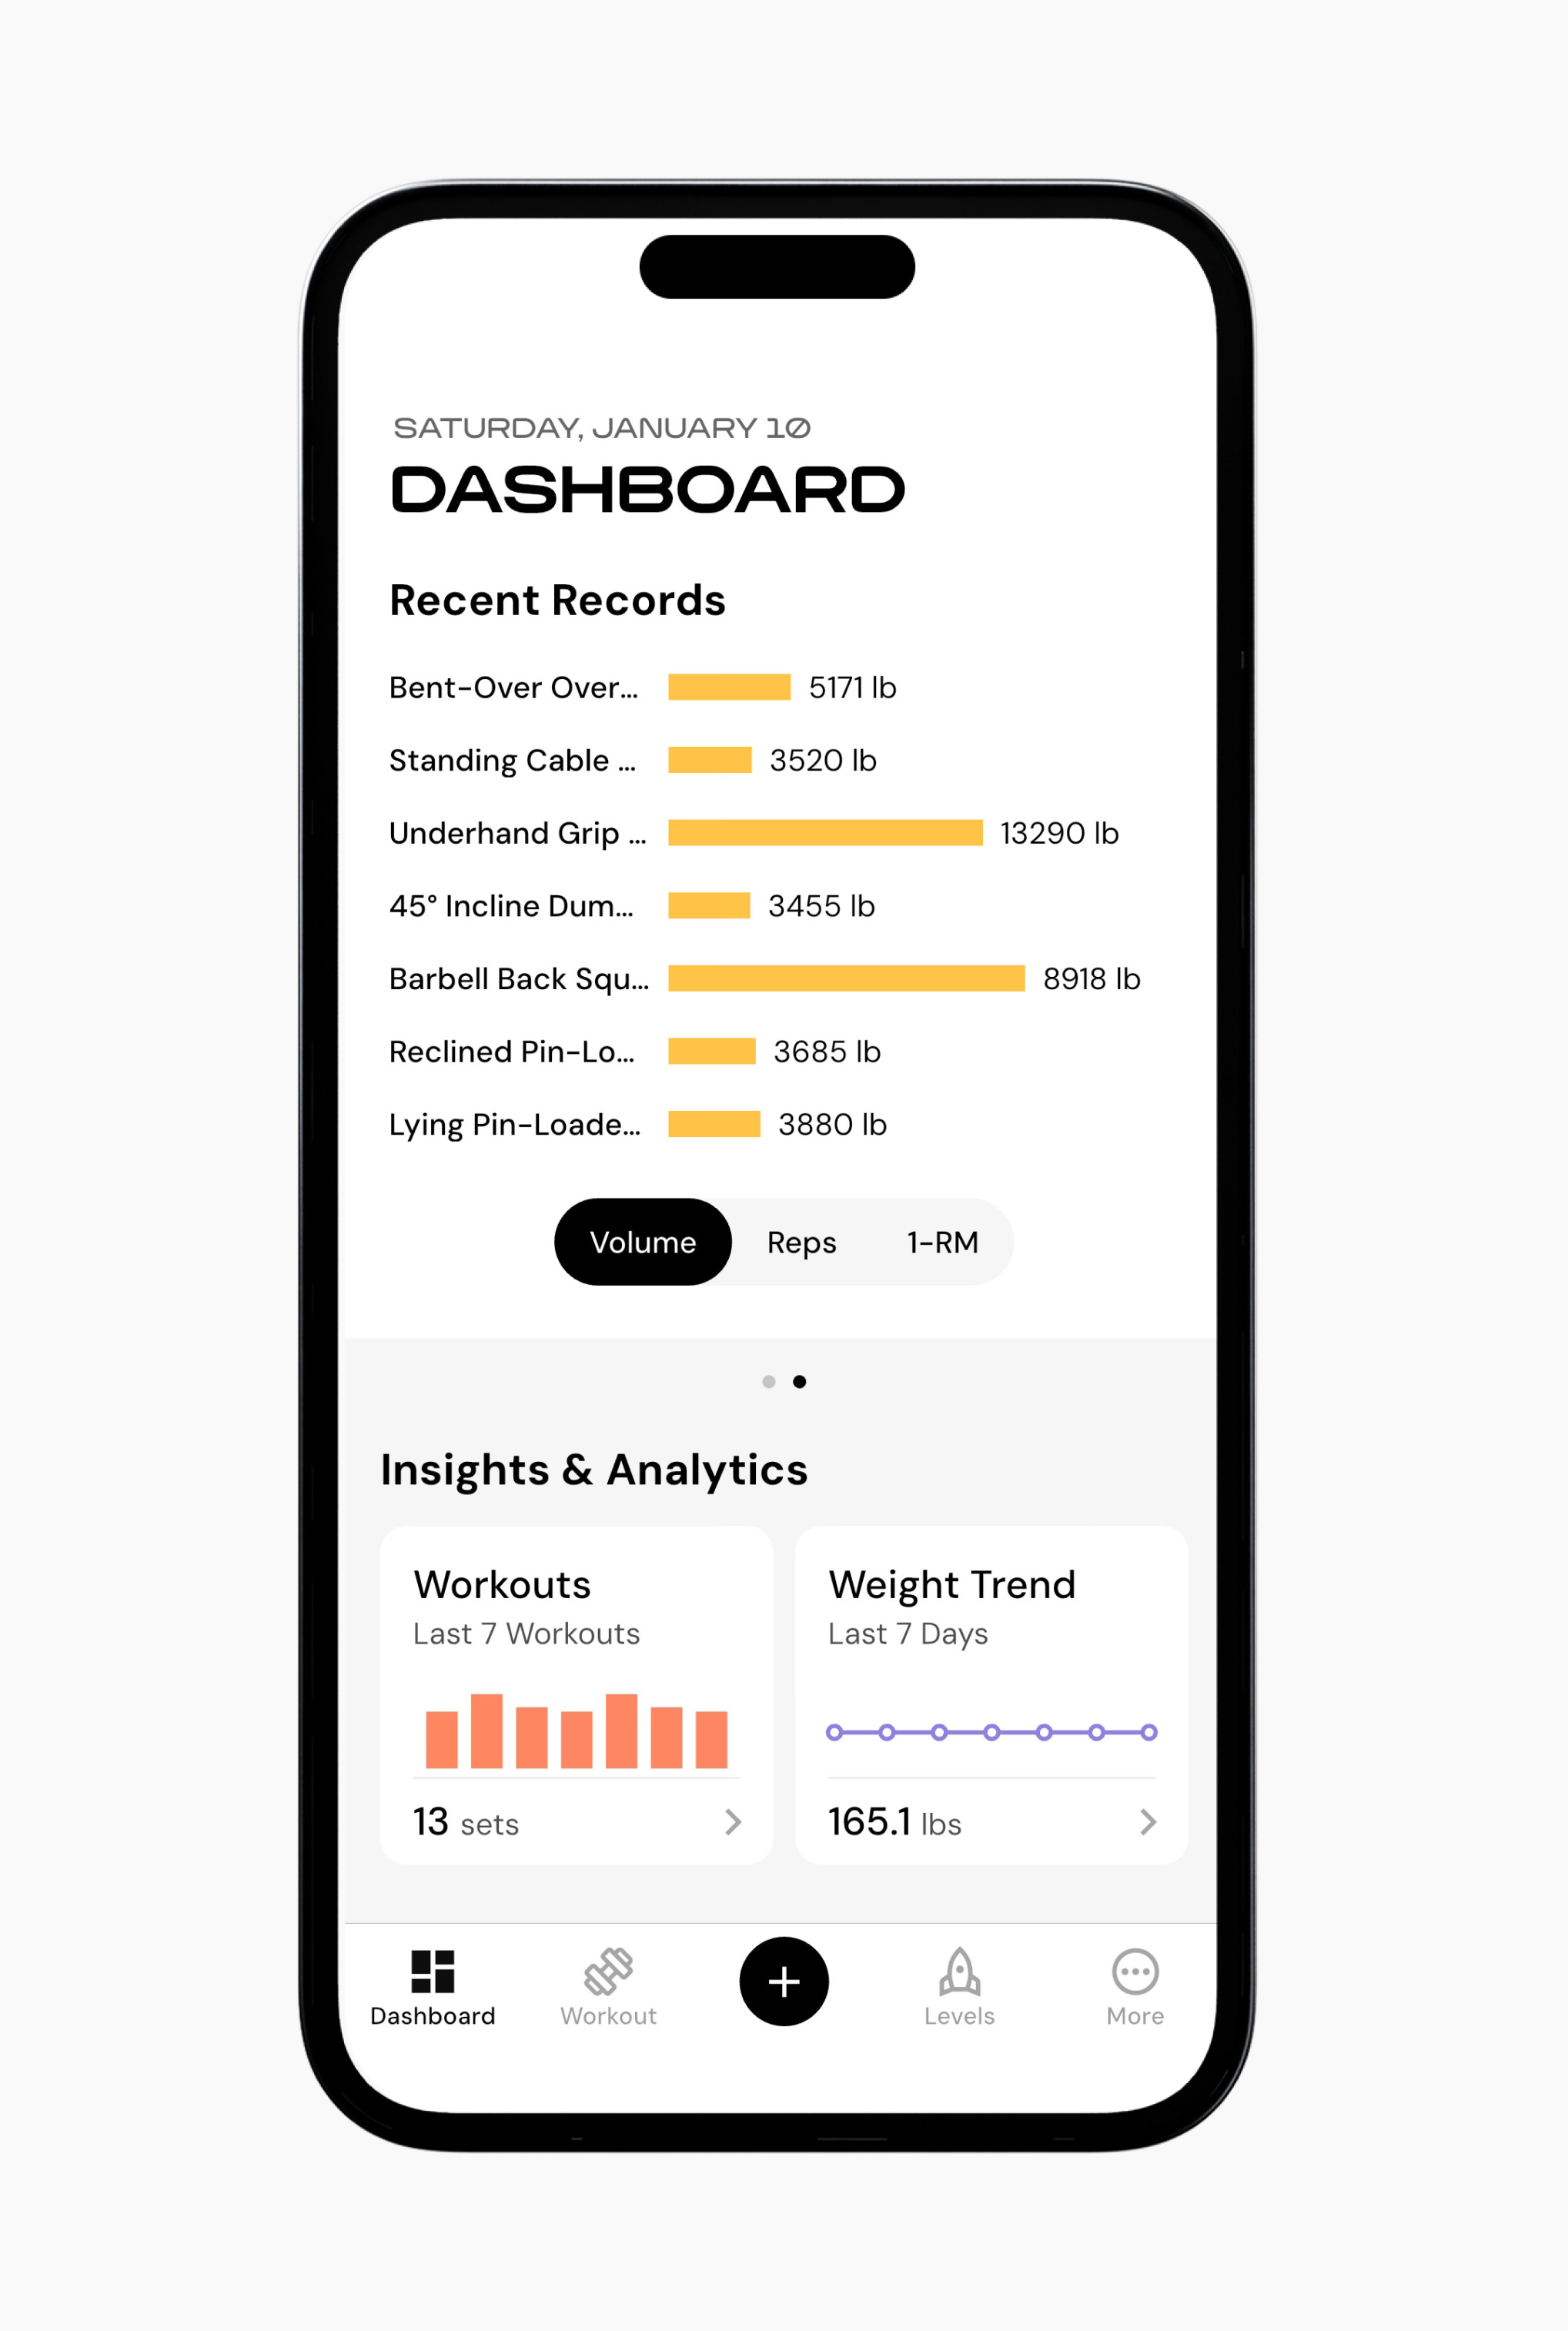
You can toggle between three record types:
Volume: Total training volume for each exercise
Reps: Highest recent repetition counts
Estimated 1-RM: Recent estimated one-repetition maximum based on logged sets
This does not replace detailed exercise history or trained muscle groups, which are available elsewhere in the app.
The next section of the dashboard is the Insights & Analytics section. The widgets in this section display interpreted training information. You can tap on these widgets to view insights that help you better understand your training.
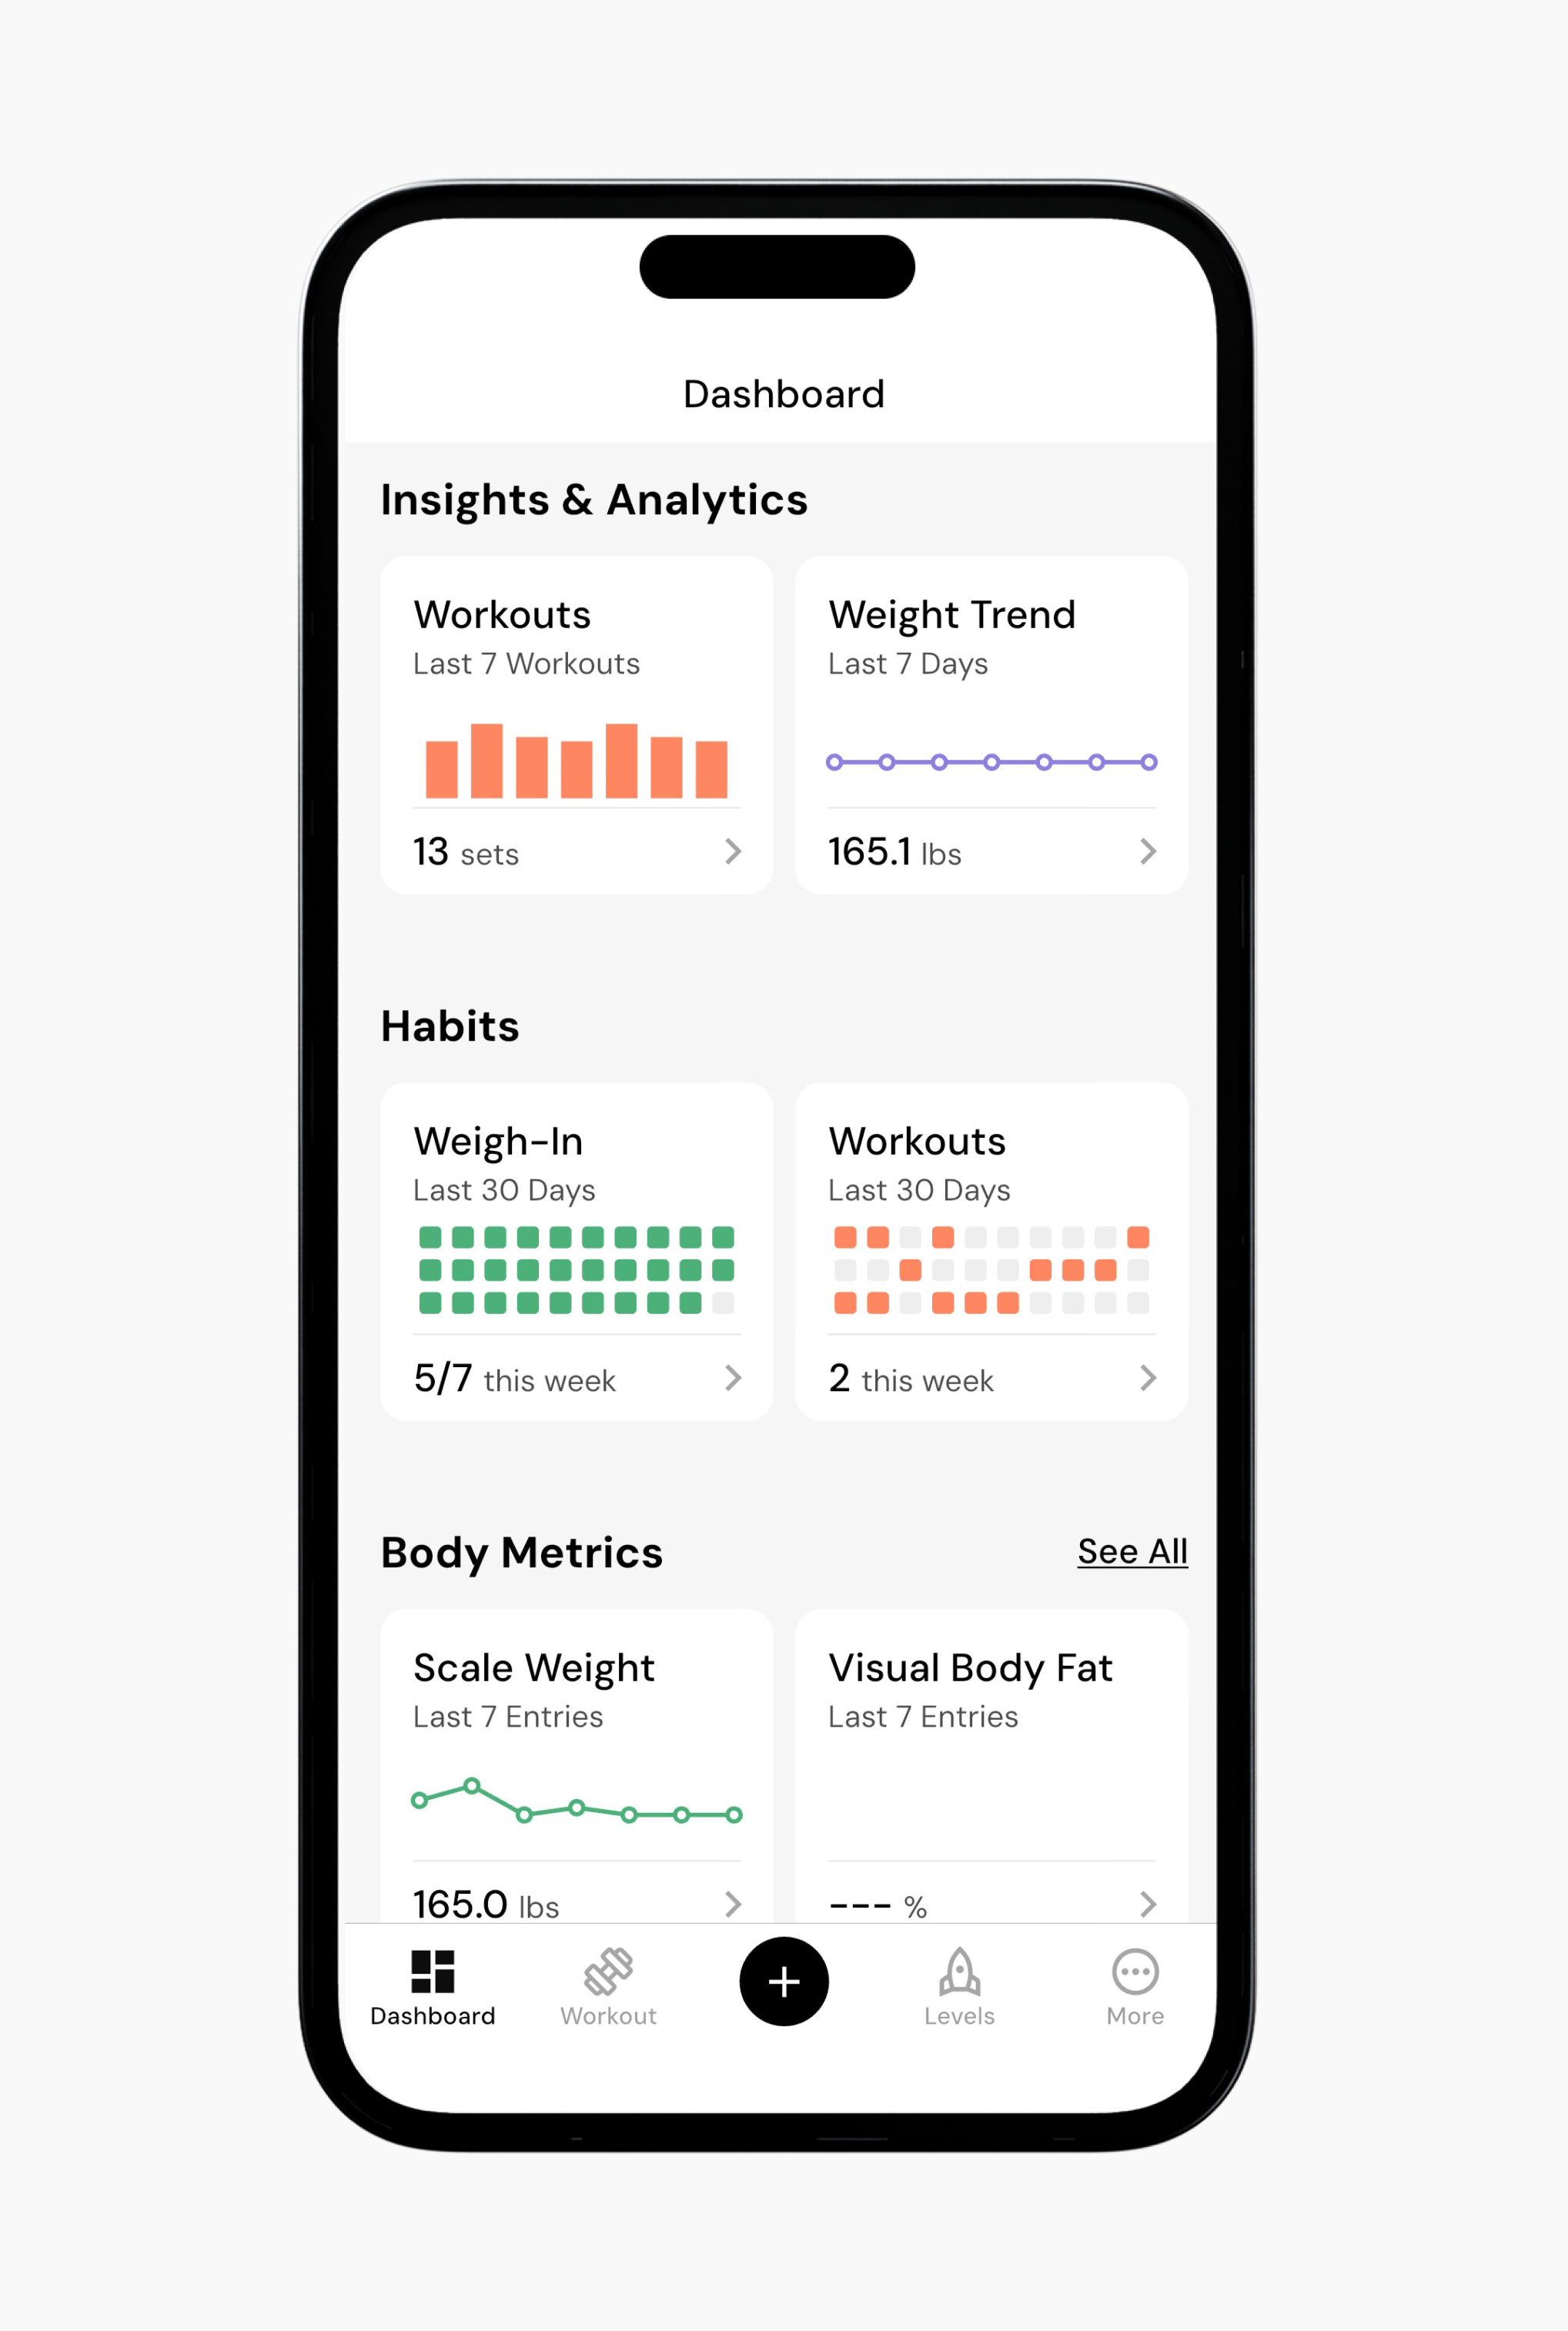
The Workouts widget shows how your sets and volume have changed over time. You can view this data across different time ranges, from a single week to your full training history.
You also get a separation of training volume from external load, bodyweight, or a mix of both. This can make it easier to interpret workload trends, especially if your training includes a lot of bodyweight movements.
Lastly, this section highlights the exercises that contributed the most total volume over the selected period. Each entry shows the exercise name and the total volume accumulated, and tapping an exercise opens its detailed history.
The Weight Trend screen helps you understand how your weight is changing over time while cutting through the noise of daily weight fluctuations. You can read more about your weight trend here.
The Habits section shows your consistency with workouts and weigh-ins over time. When you tap this widget, you can view a calendar-style history that highlights completed workouts, streaks, and recent activity. You can select any day to log your weight or mark that you worked out that day. Note that while you can log a workout from this view, you still need to enter the workout details in your workout program or as an additional workout in the workout section of the app if you want it to contribute to your workout analytics.
The Body Metrics widget allows you to track, monitor, and visualize changes to scale weight, 24 different body measurements, and progress photos from three different angles. You can read more about body metric and progress photo tracking here.
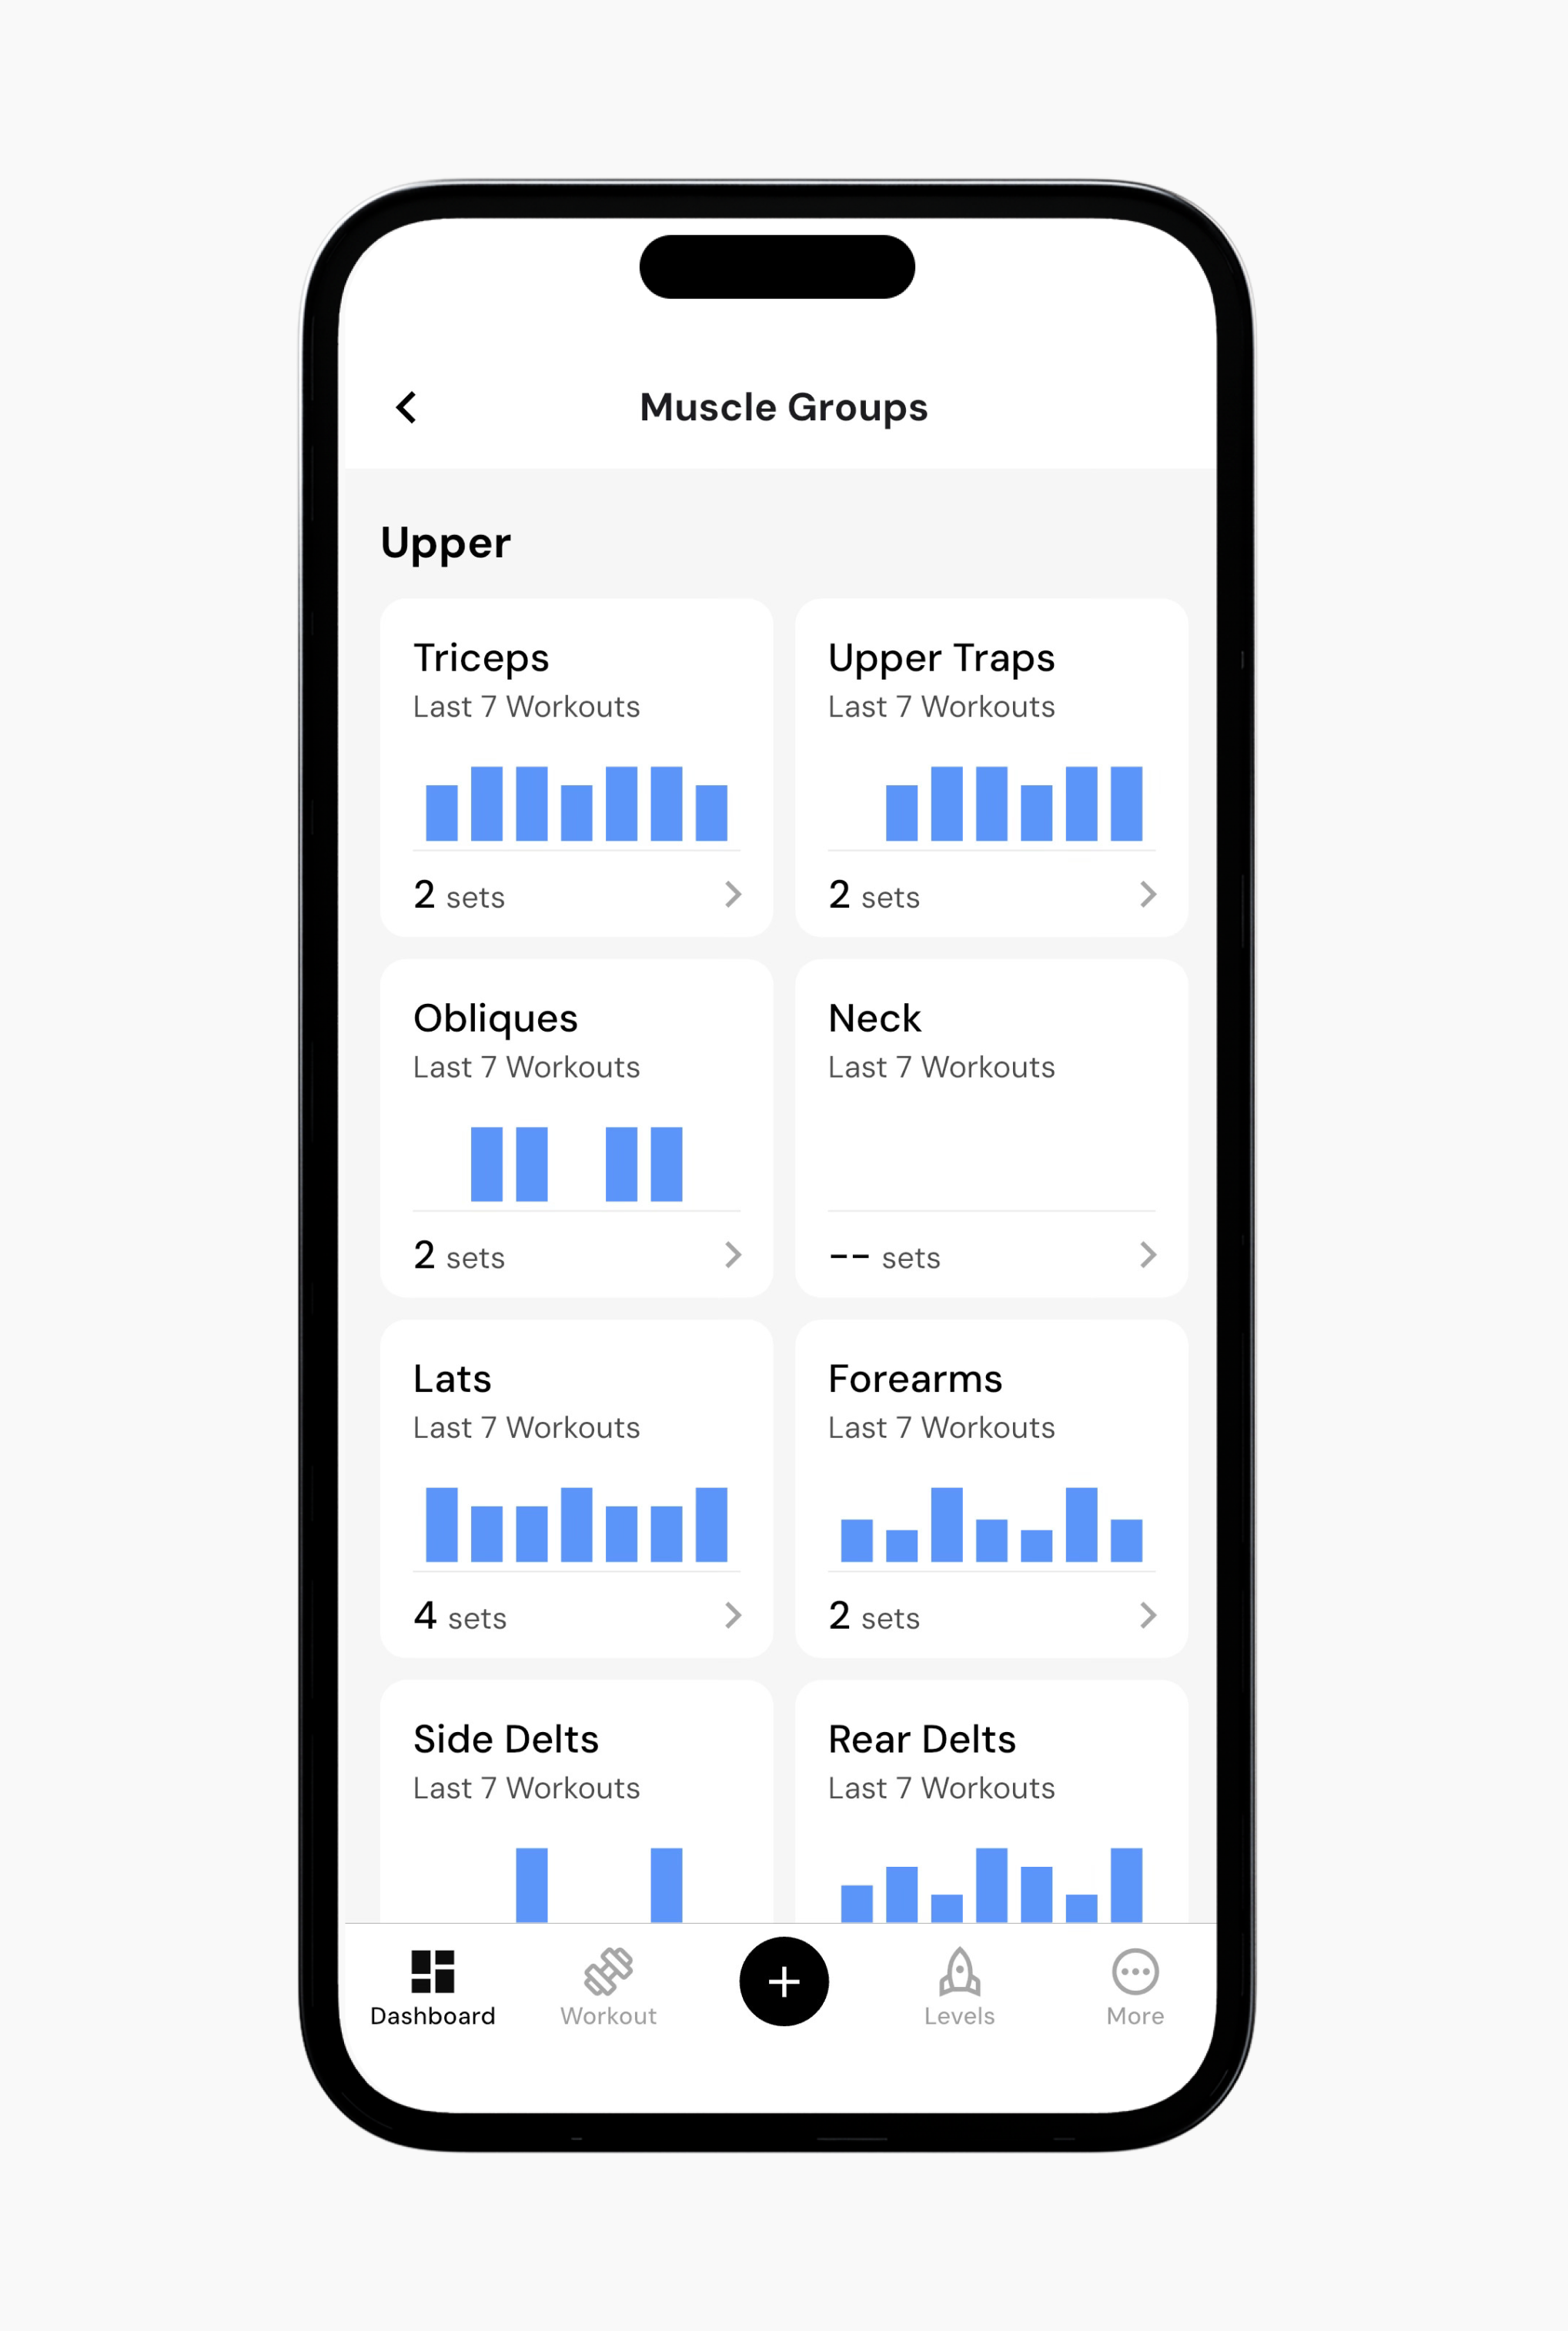
The Muscle Groups section organizes your training data by muscle group rather than by workout or exercise. Each tile shows how many sets or how much volume each muscle group received over the selected time span. This makes it easier to see, at a glance, which muscle groups you train most often and which may be getting overlooked. Over time, this view helps highlight gaps in training coverage and can help you maintain better balance within your training programs.
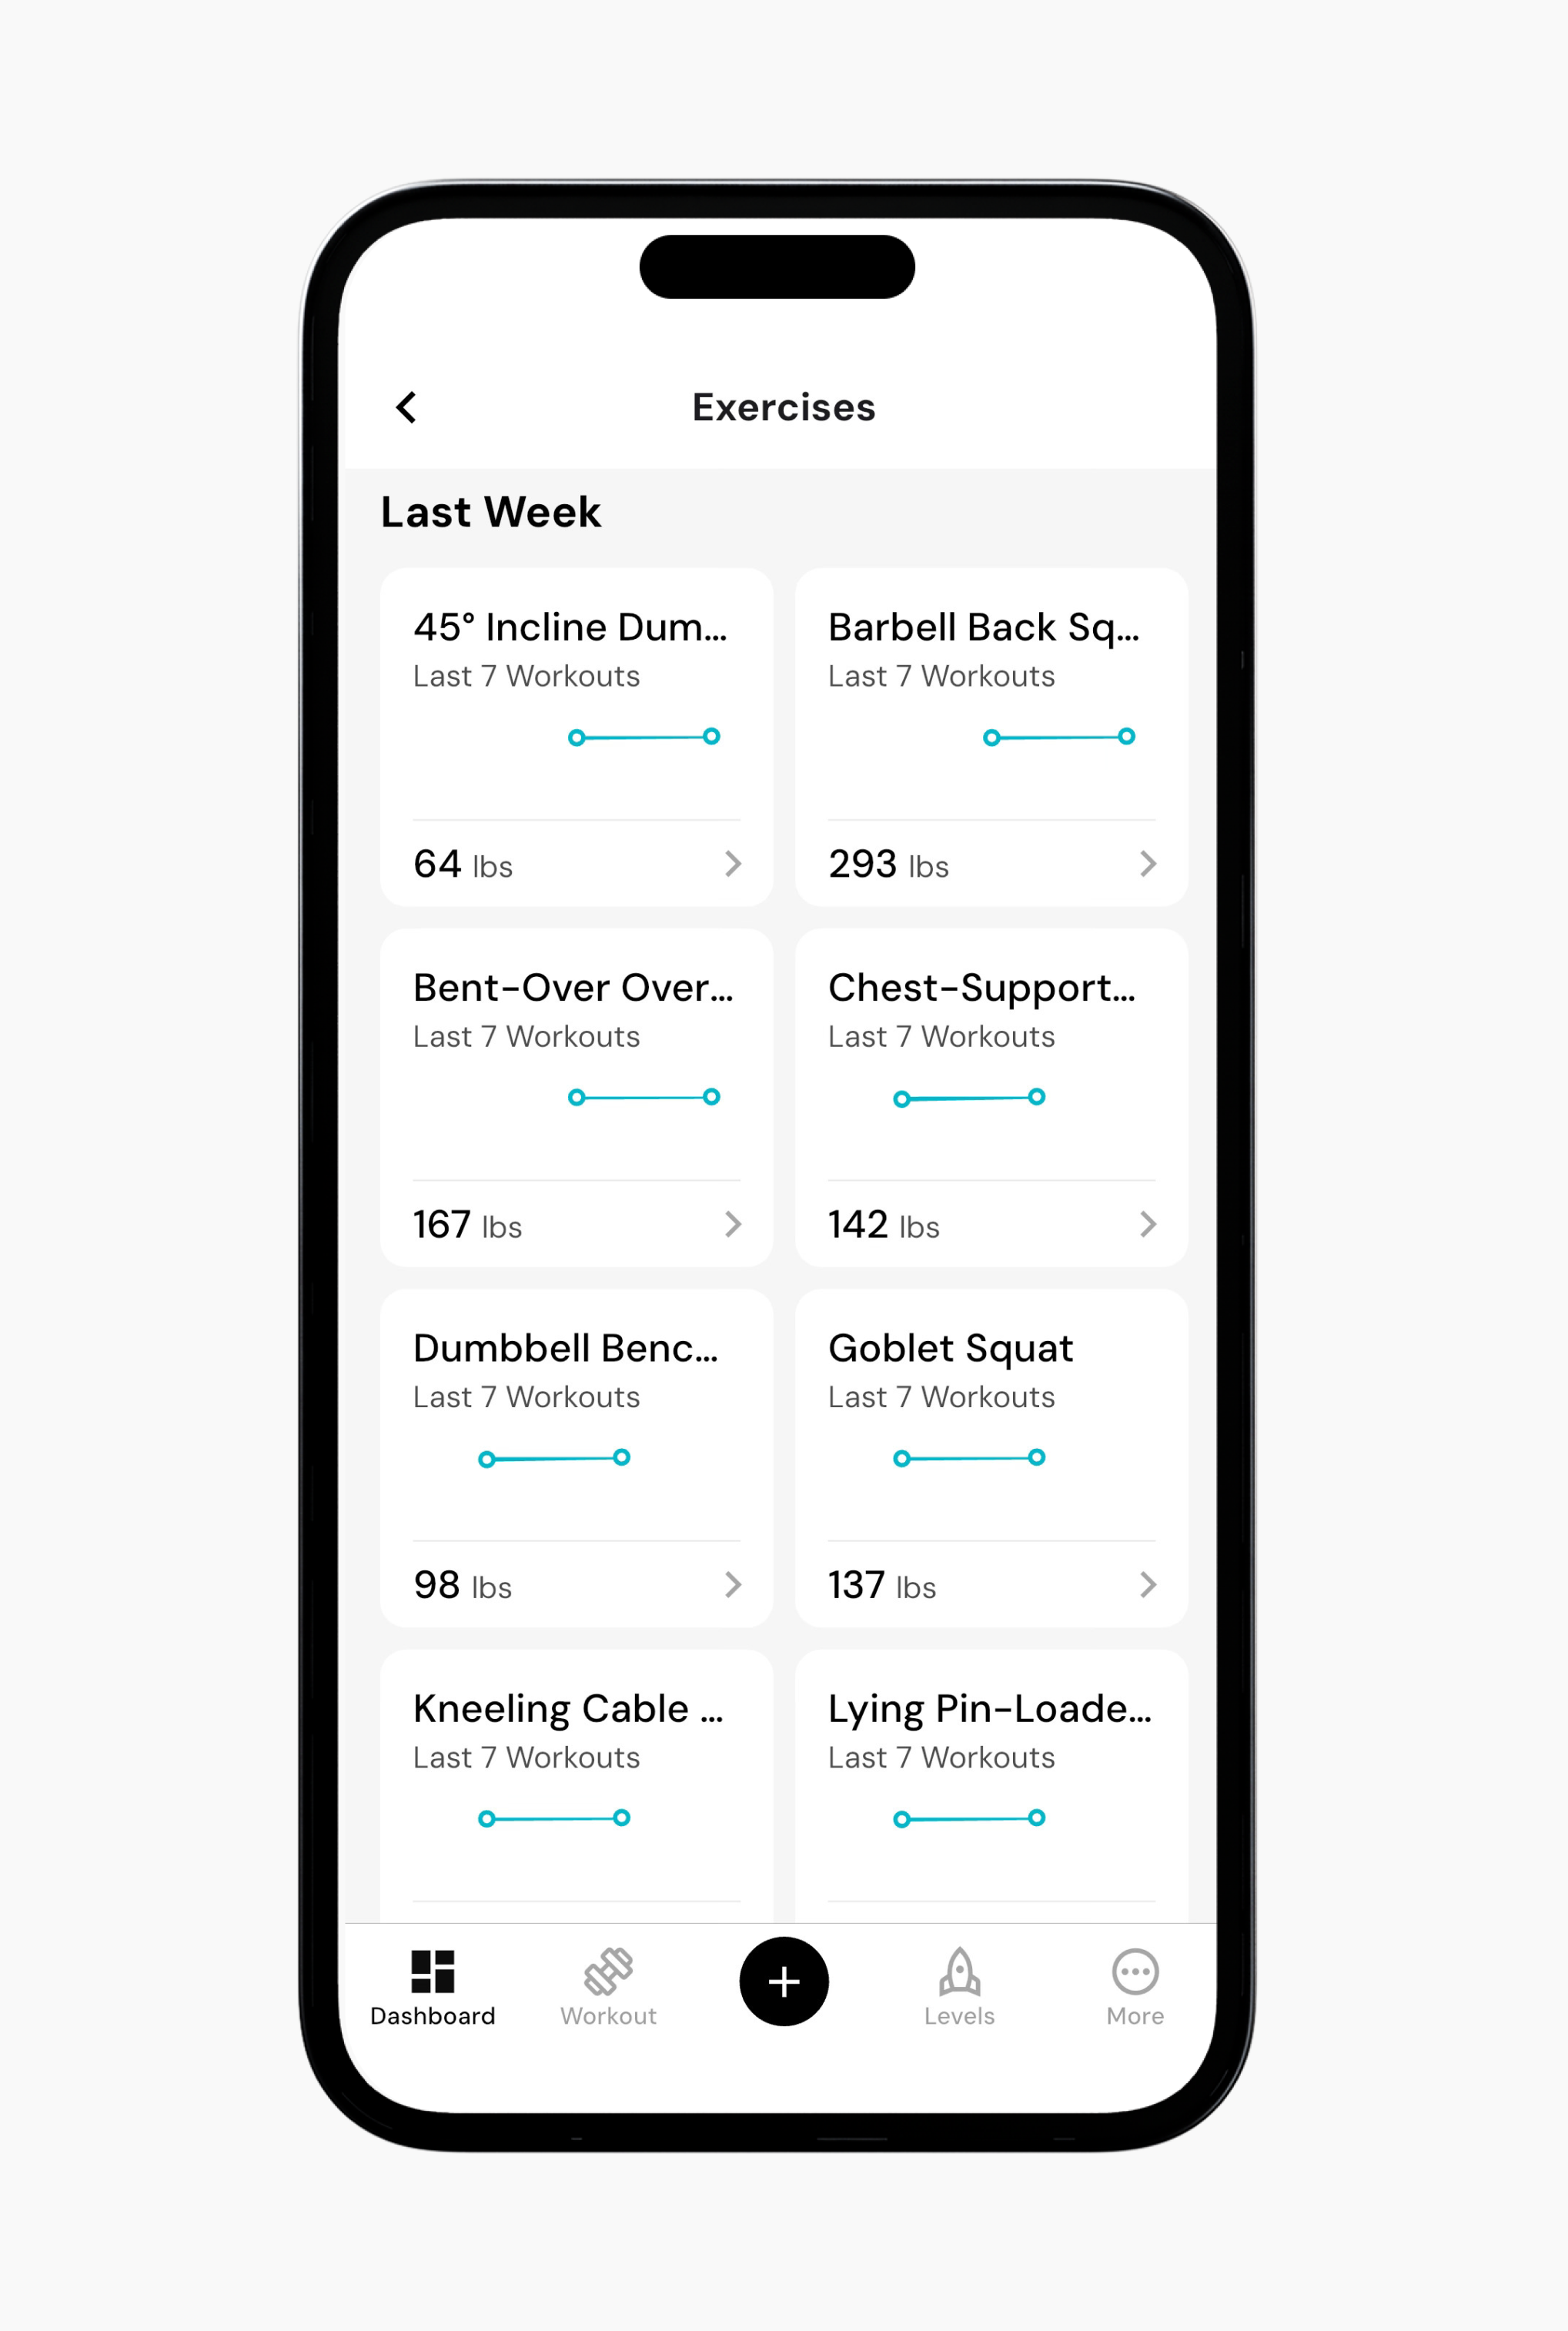
The Exercises section organizes your training data via individual exercises (rather than by workout or muscle group). Each exercise tile shows your recent load, along with a trend line based on your last several workouts.
When you tap an exercise, you can also view several performance metrics, such as total volume, heaviest weight, or total reps. You can also change the time range from short- to long-term trends. Over time, this can help you see whether an exercise is progressing or losing momentum without needing to examine individual workouts.
The Steps section shows your daily step count over time as pulled from your integrated data source. You can switch between different time ranges along with your average steps for the selected period.
The Period widget tracks cycle history in a calendar-style view. This makes it easy to see when data was last logged and how your cycle may relate to your training.
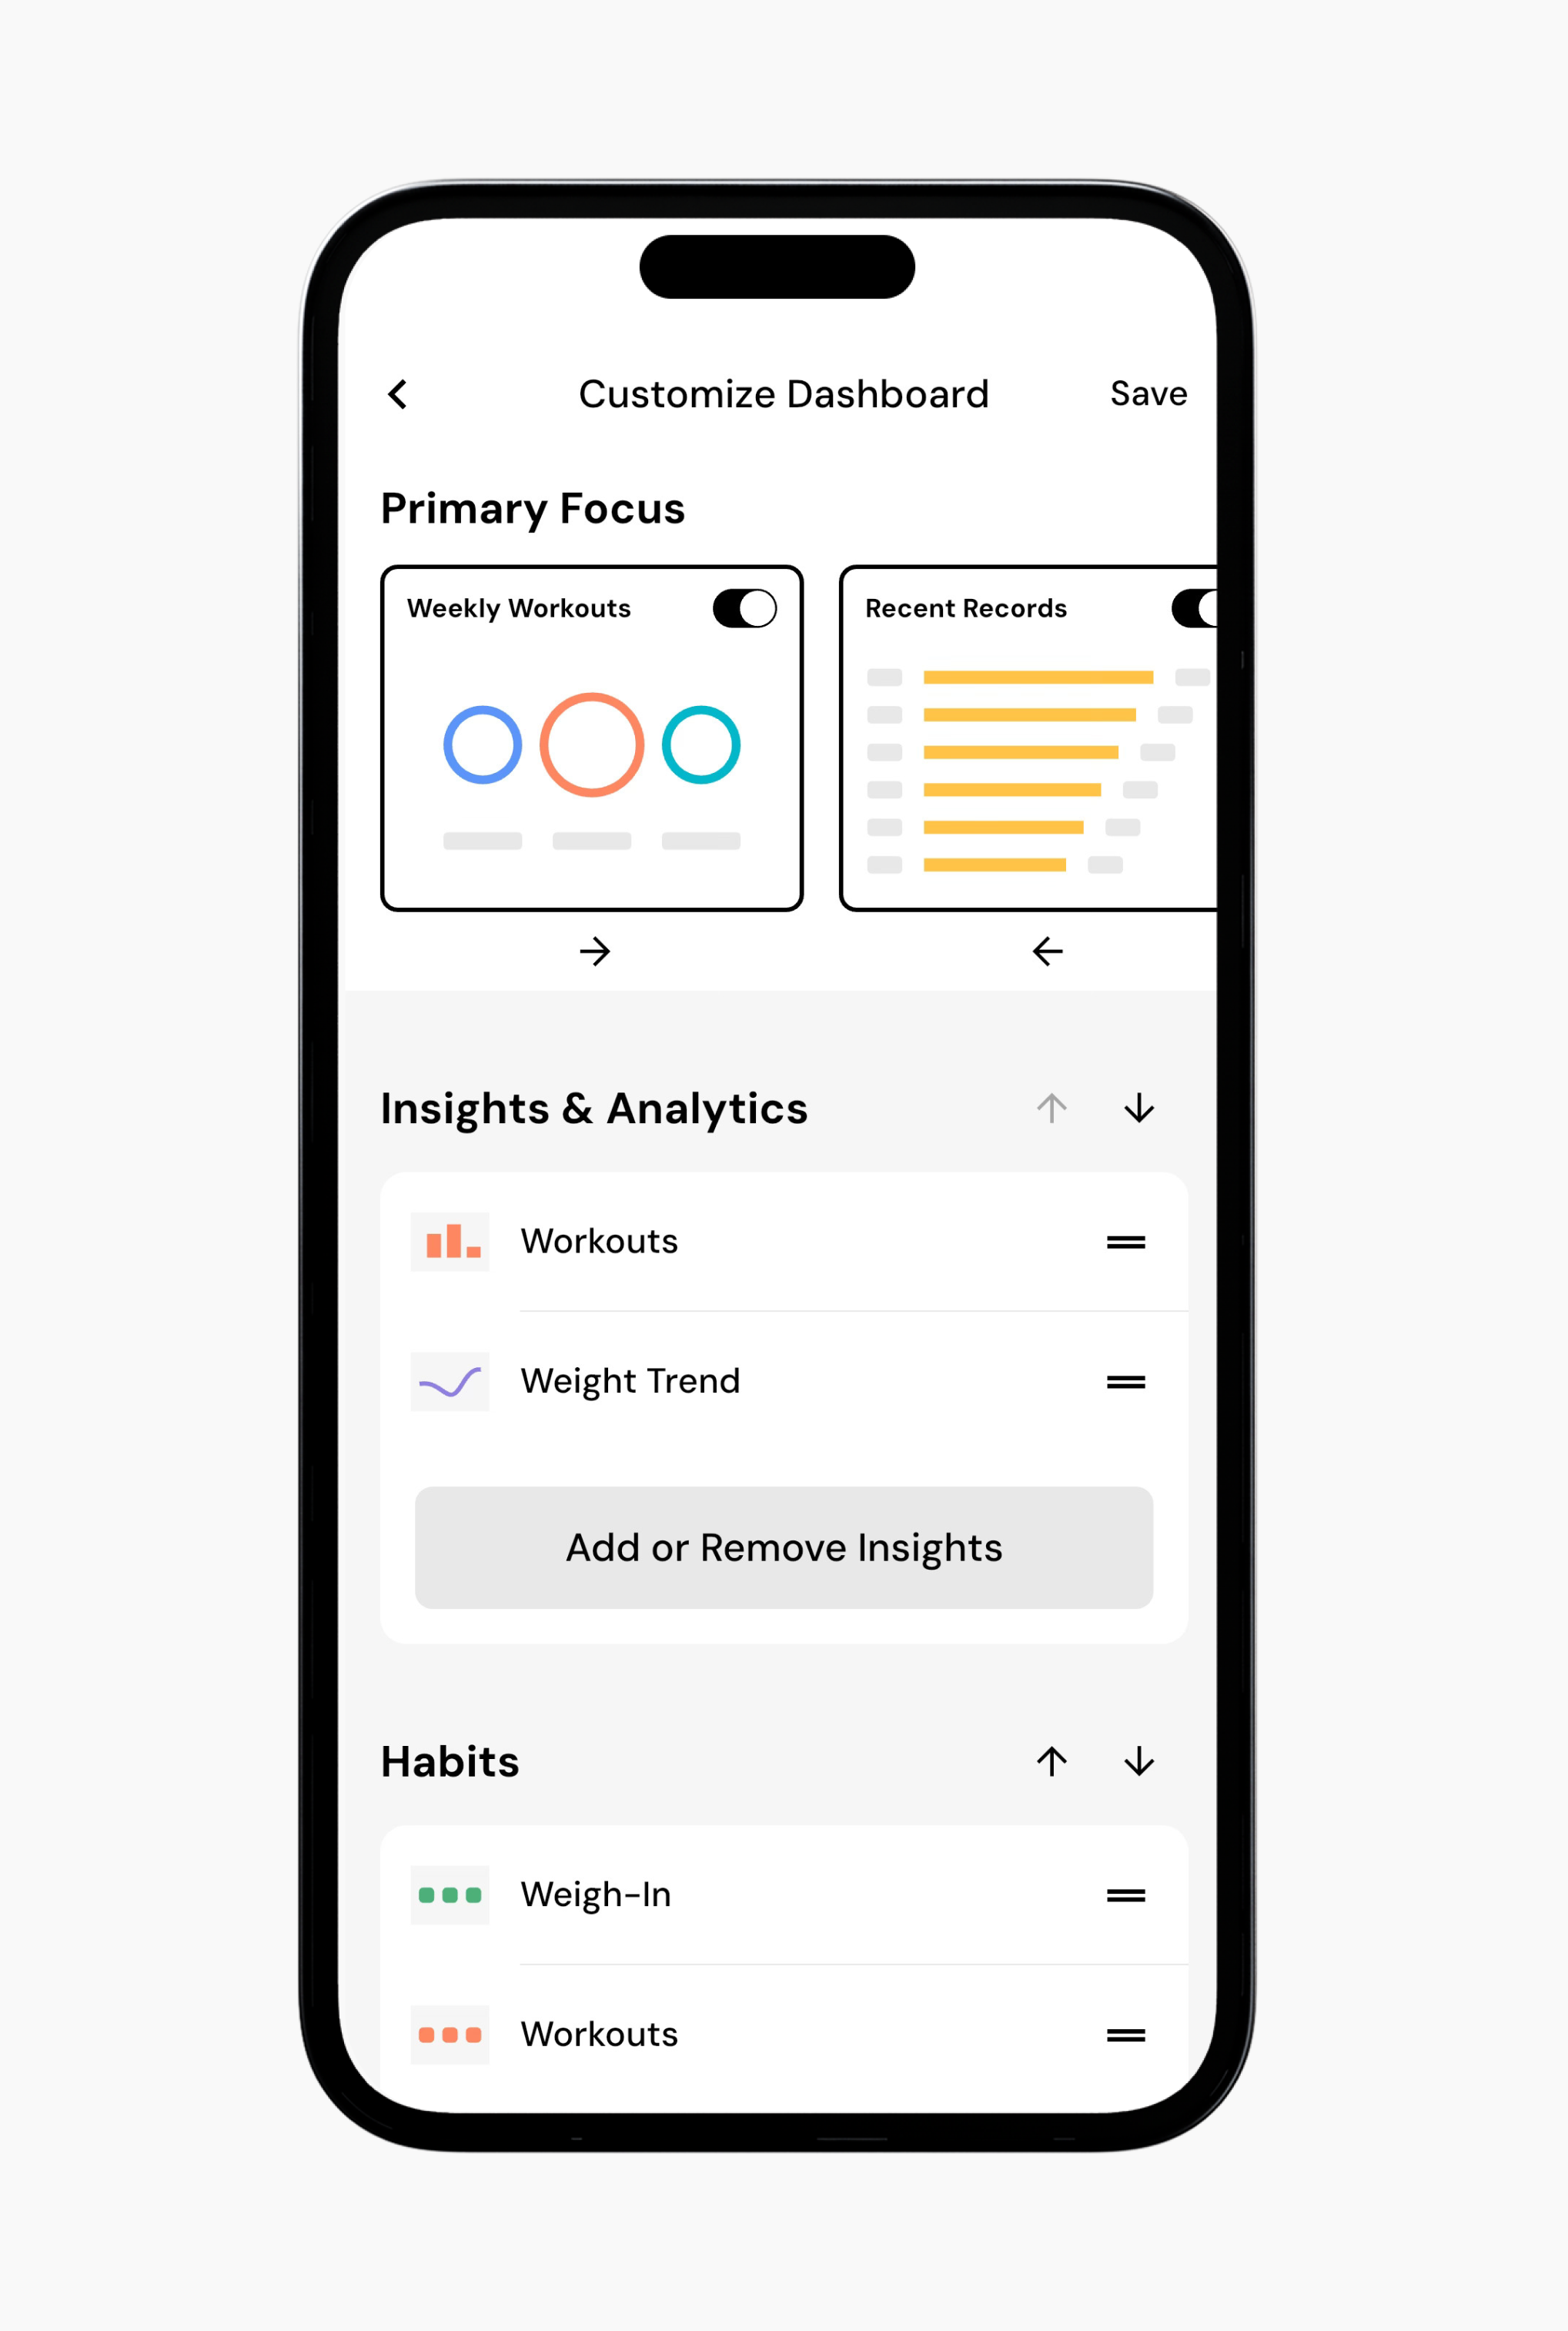
At the bottom of the dashboard, you can customize how your dashboard appears. Tapping Customize Dashboard lets you choose which sections to show or hide. You can adjust the layout to fit what you want to see most often or arrange the order you see it. You can read more about dashboard customization here.
Now that you’ve learned about your dashboard, you might enjoy one of these articles next:
How to Customize Your Dashboard
Create a New Program via Smart Generation
Create a New Program via Build From Scratch