MacroFactor's dashboard is split into four sections.
The top section of the dashboard is designed to help you understand your nutrition intake through a few different lenses. It allows you to understand your nutrition intake for the current week, your nutrition intake relative to your goals and expenditure, and your nutrition intake for the day in progress. For a deeper dive on this section of the dashboard, you may also enjoy this article.
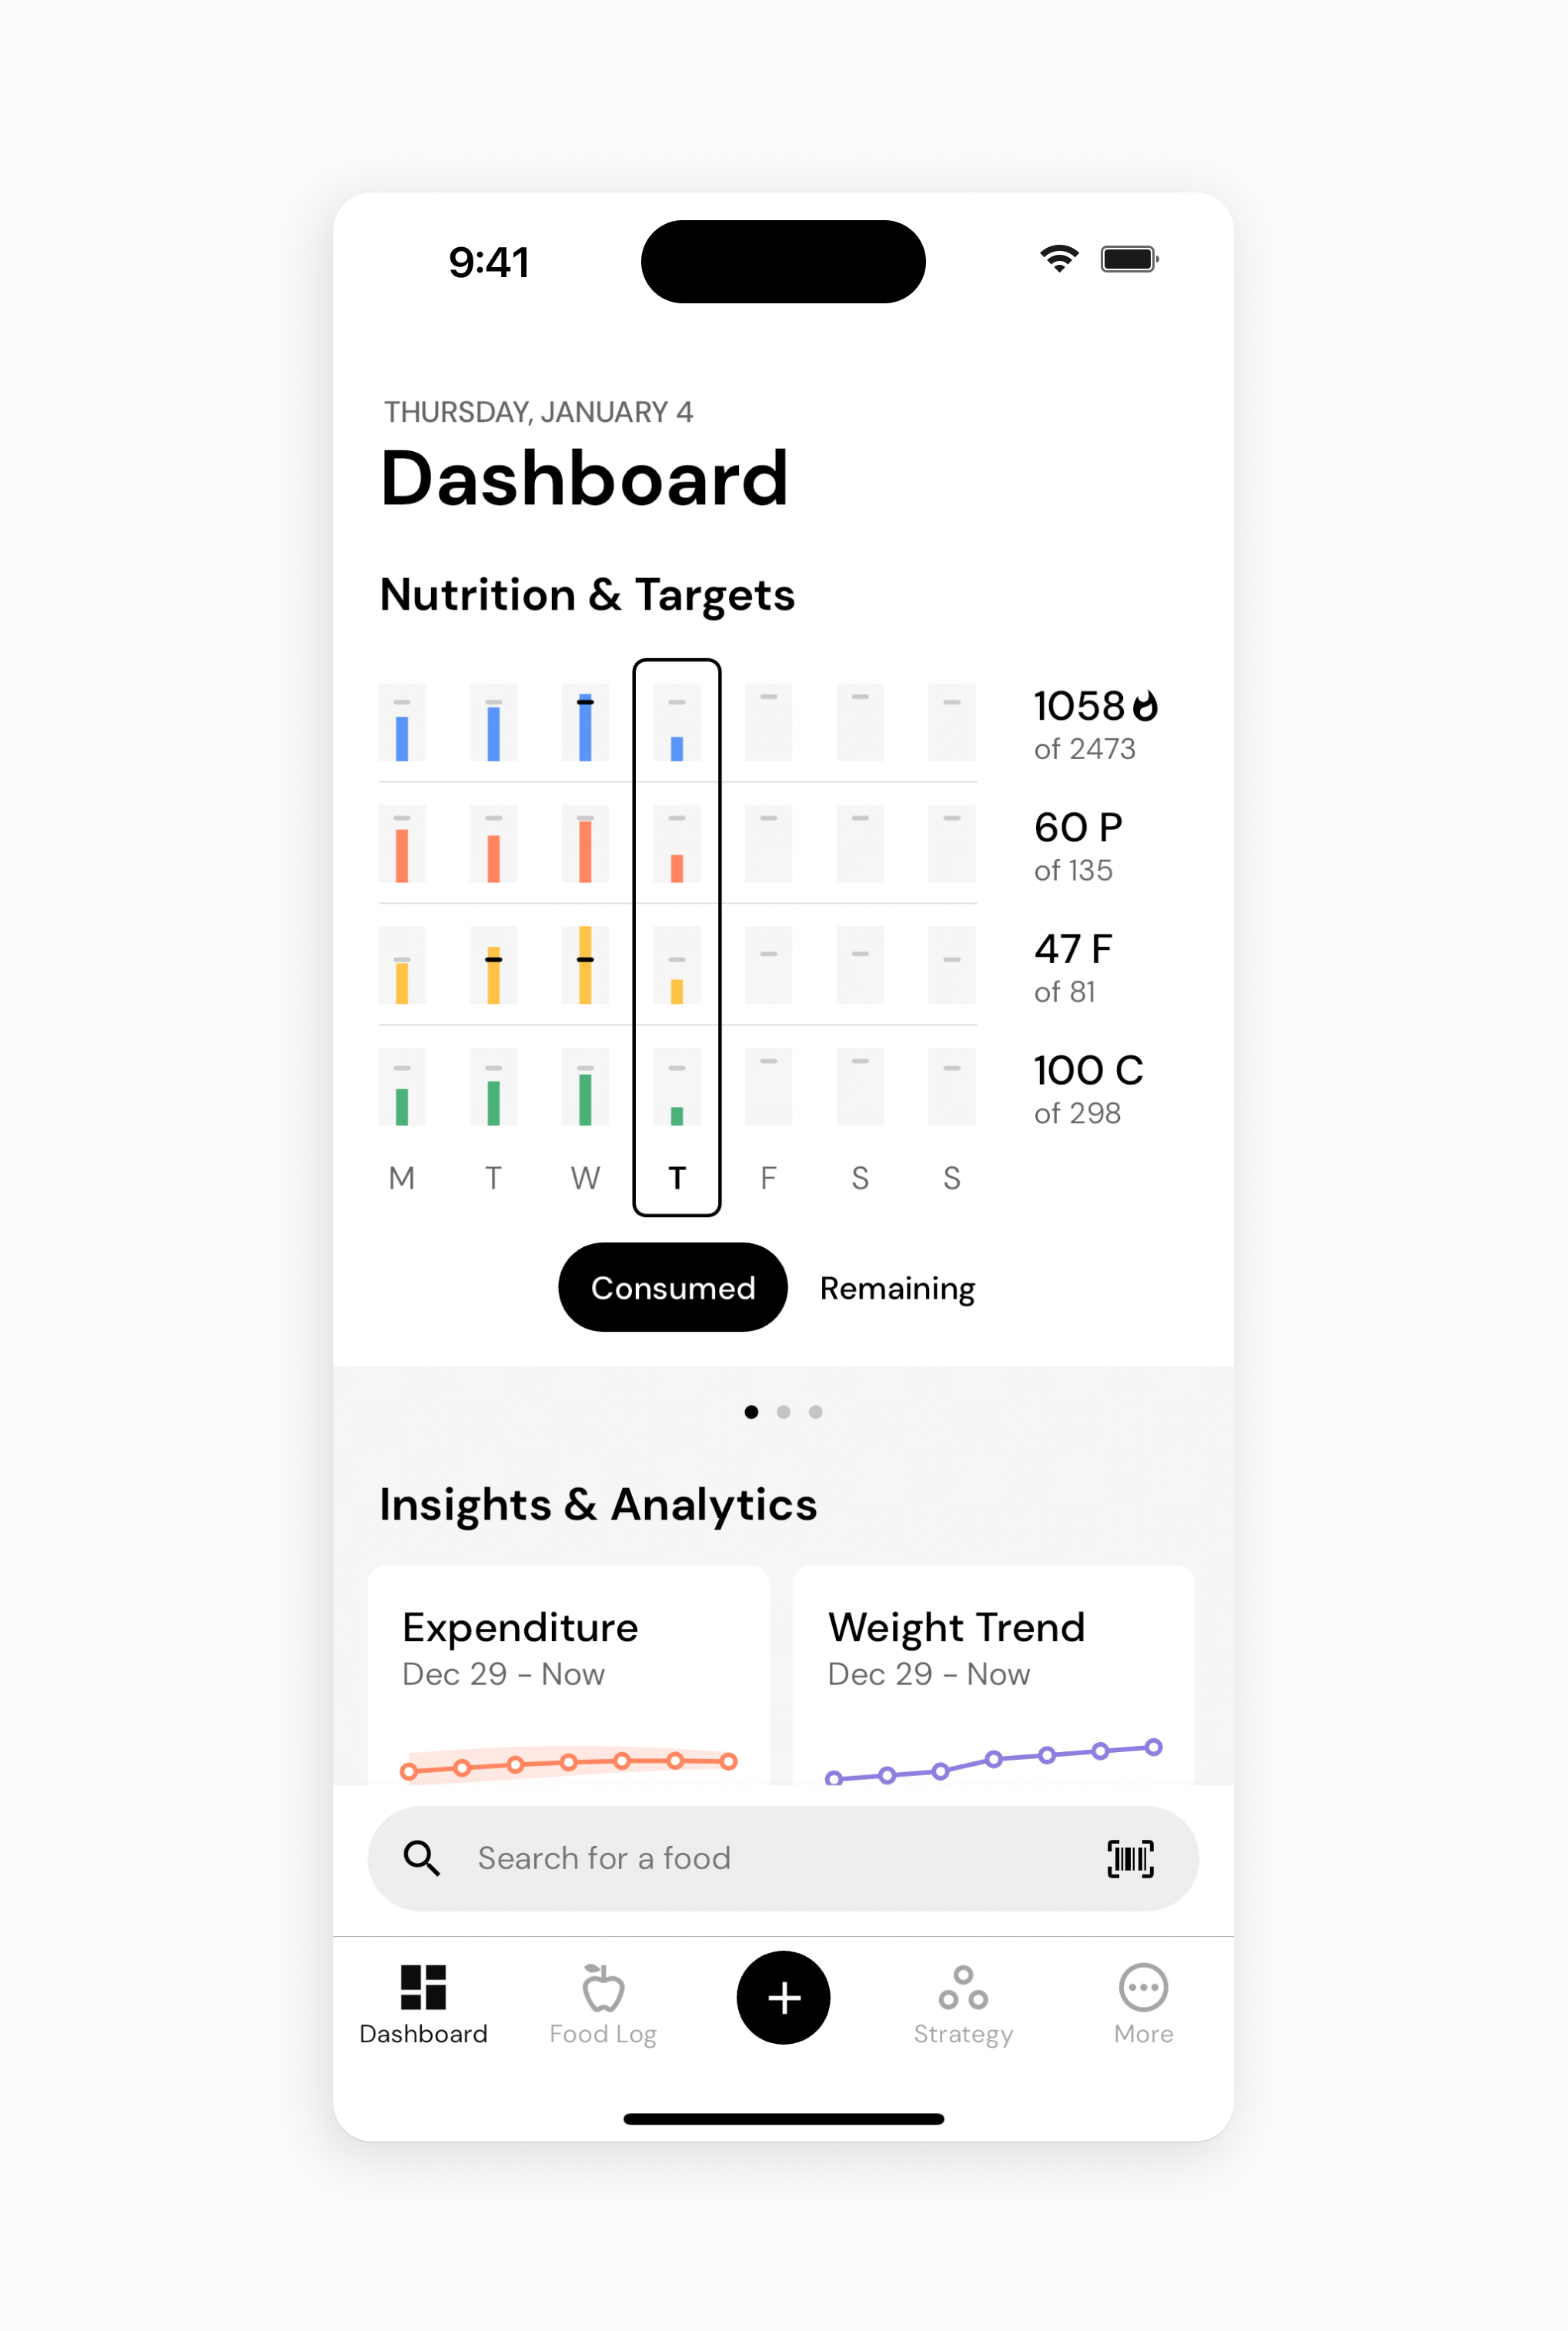
The "Nutrition & Targets" view shows you your daily nutrition intake and targets in relation to your weekly intake and targets. There's a box around the day in progress to draw your focus to the present day, but you can see your intake and targets for previous days and future days. The top bar for each day shows your calorie intake target, the second bar shows your protein target, the third bar shows your fat target, and the bottom bar shows your carbohydrate target. When you start each day, there's a gray line on each bar showing your intake target for the day – if you reach or exceed your target intake, the bar will turn black (in light mode) or white (in dark mode), providing a visual indicator that you've reached your target. You can tap on any day's bars to view your intake and targets for that day. You can also tap on the currently selected day (the day with a box around it) to deselect it, and view your nutrient intake and targets for the entire week. Finally, you can toggle between "consumed" and "remaining" views, depending on whether you prefer to see how many calories and macros you've consumed for the day, or how many calories and macros you have remaining for the day.
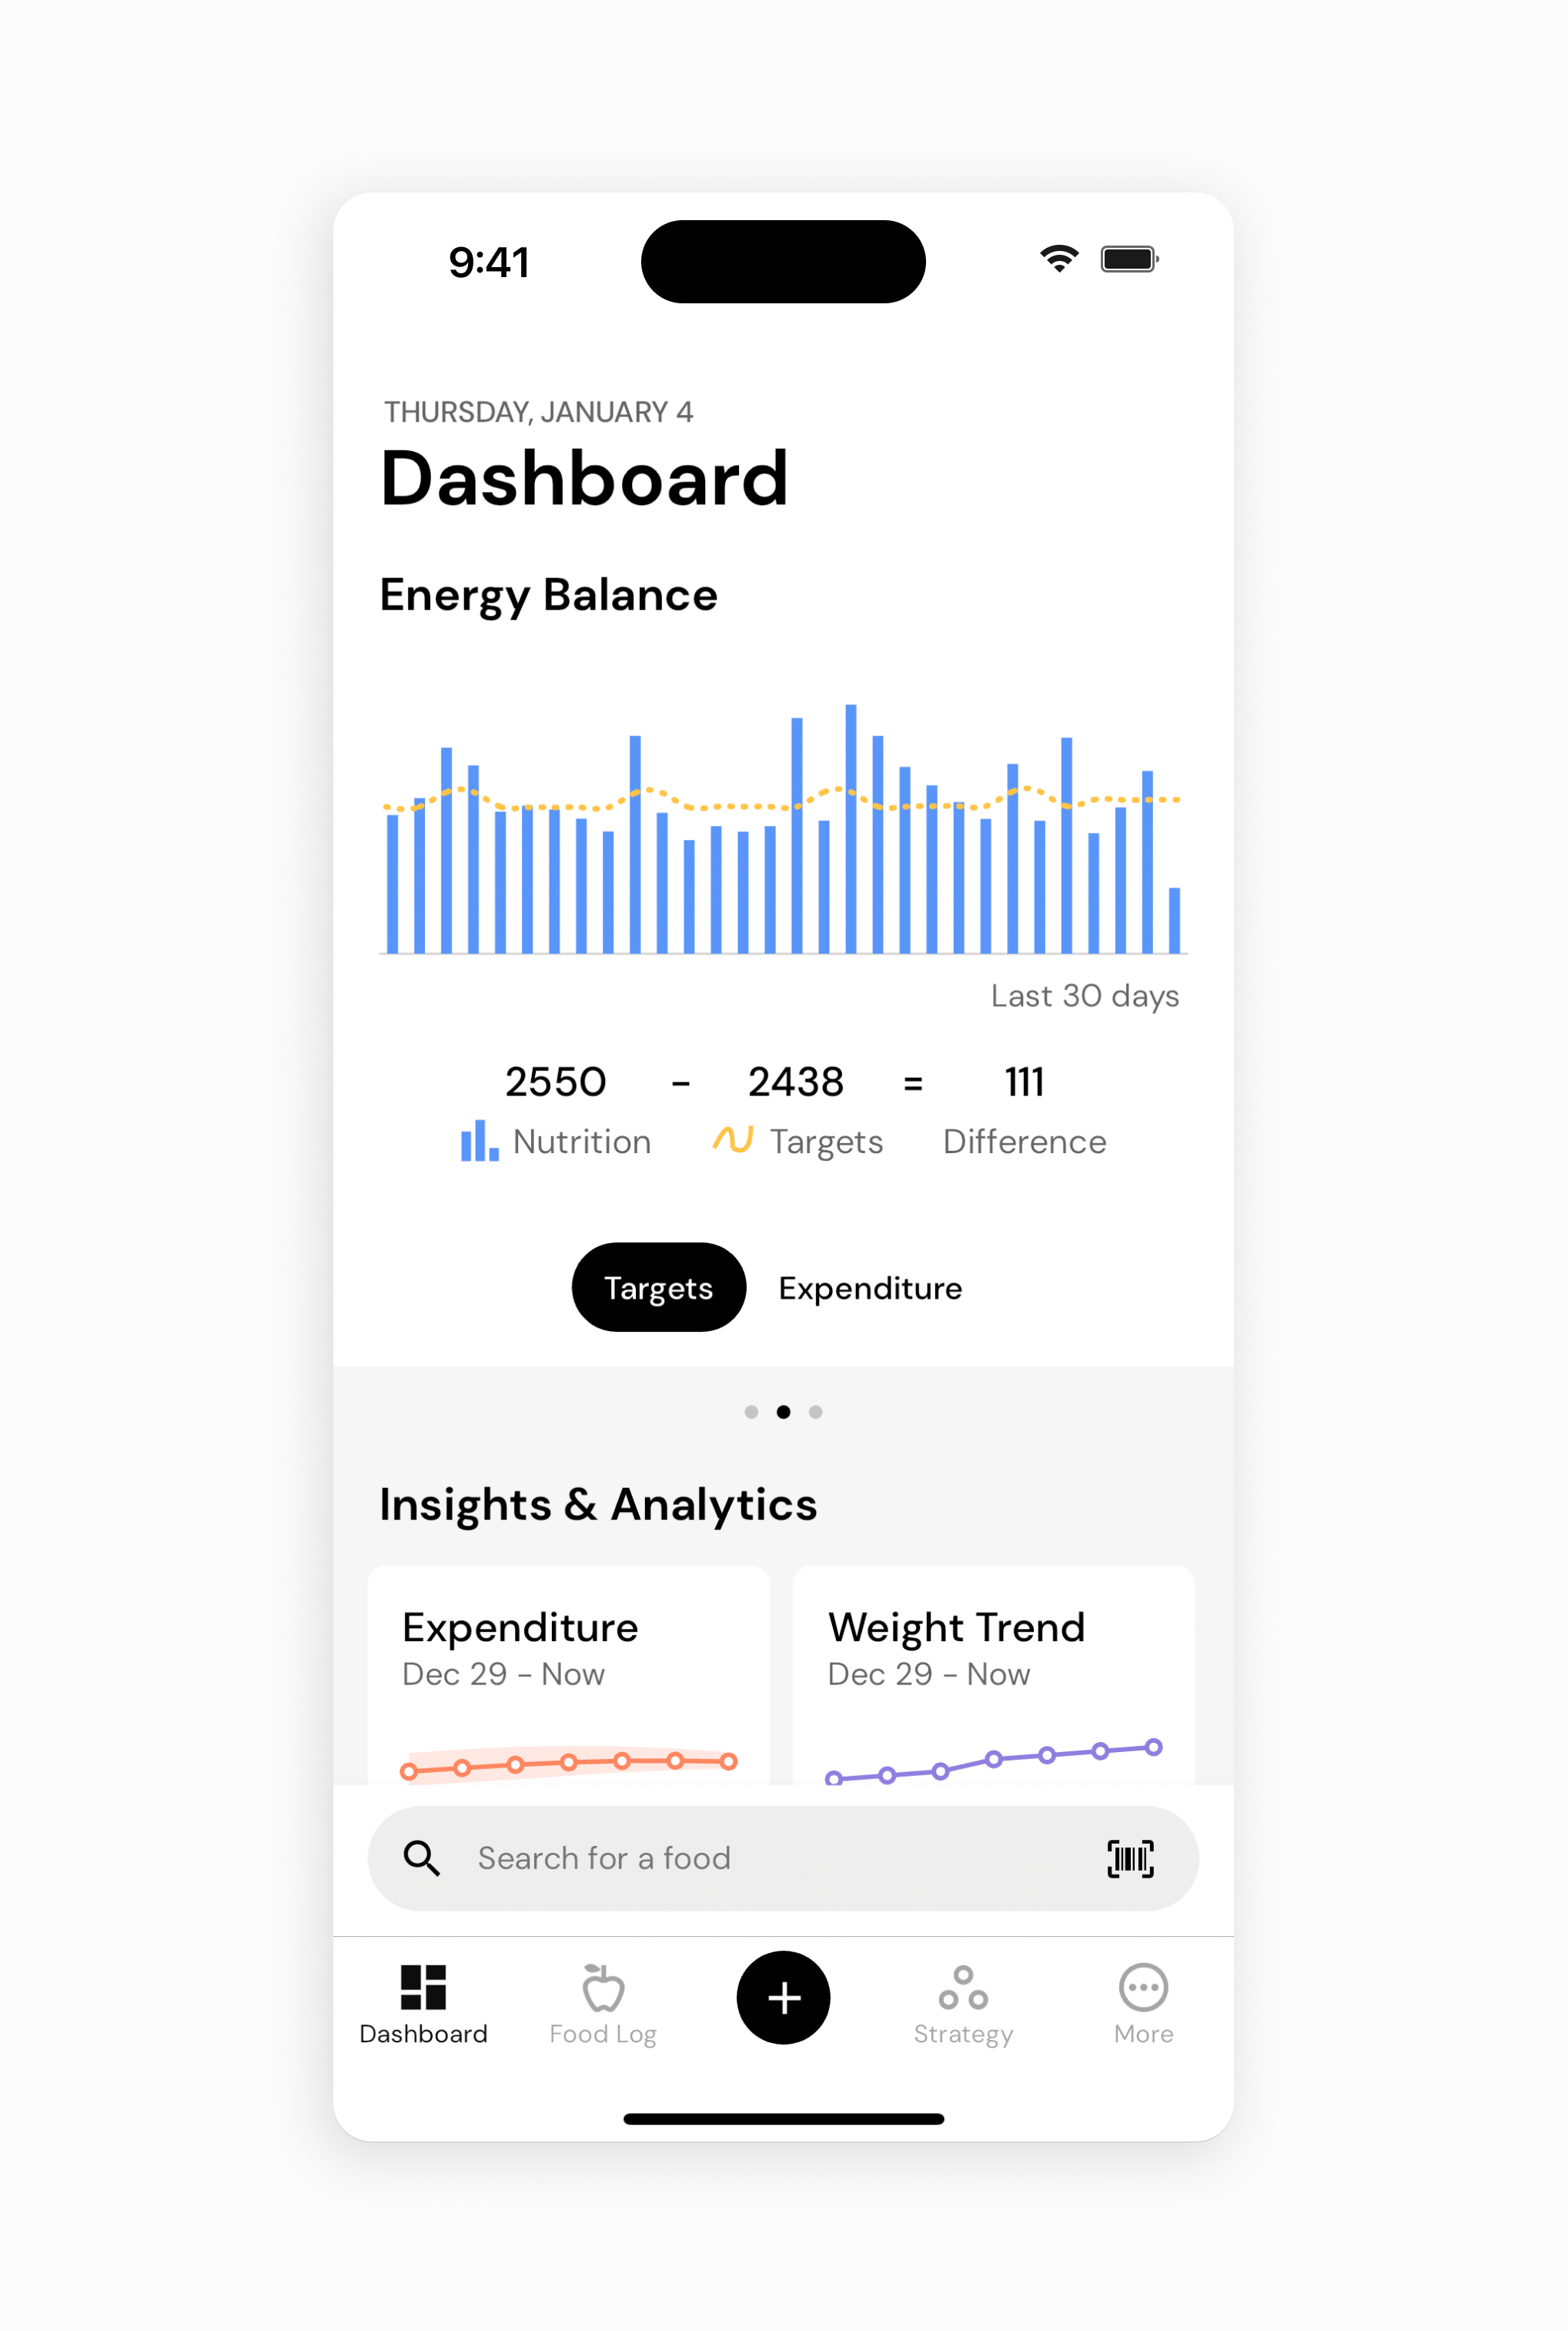
The "Energy Balance" view shows you your energy intake for the past 30 days through two different lenses. You can view your intake relative to your targets, or relative to your expenditure. This can be helpful for understanding how well you're sticking to your goals. For instance, if you have a goal of losing weight, you might occasionally exceed your calorie targets for the day, and the "Targets" view will show that your calorie intake has been a bit higher than your calorie targets for the past 30 days. However, the "Expenditure" view may still show that you have still been in a net energy deficit for the past 30 days (i.e., your energy intake has still been below your energy expenditure). In other words, your intake has been a bit too high to make progress at your desired rate, but it's still been low enough to allow you to make progress toward your weight loss goal. For a more in-depth overview of the insights you can glean from the energy balance widget, you might enjoy this article.
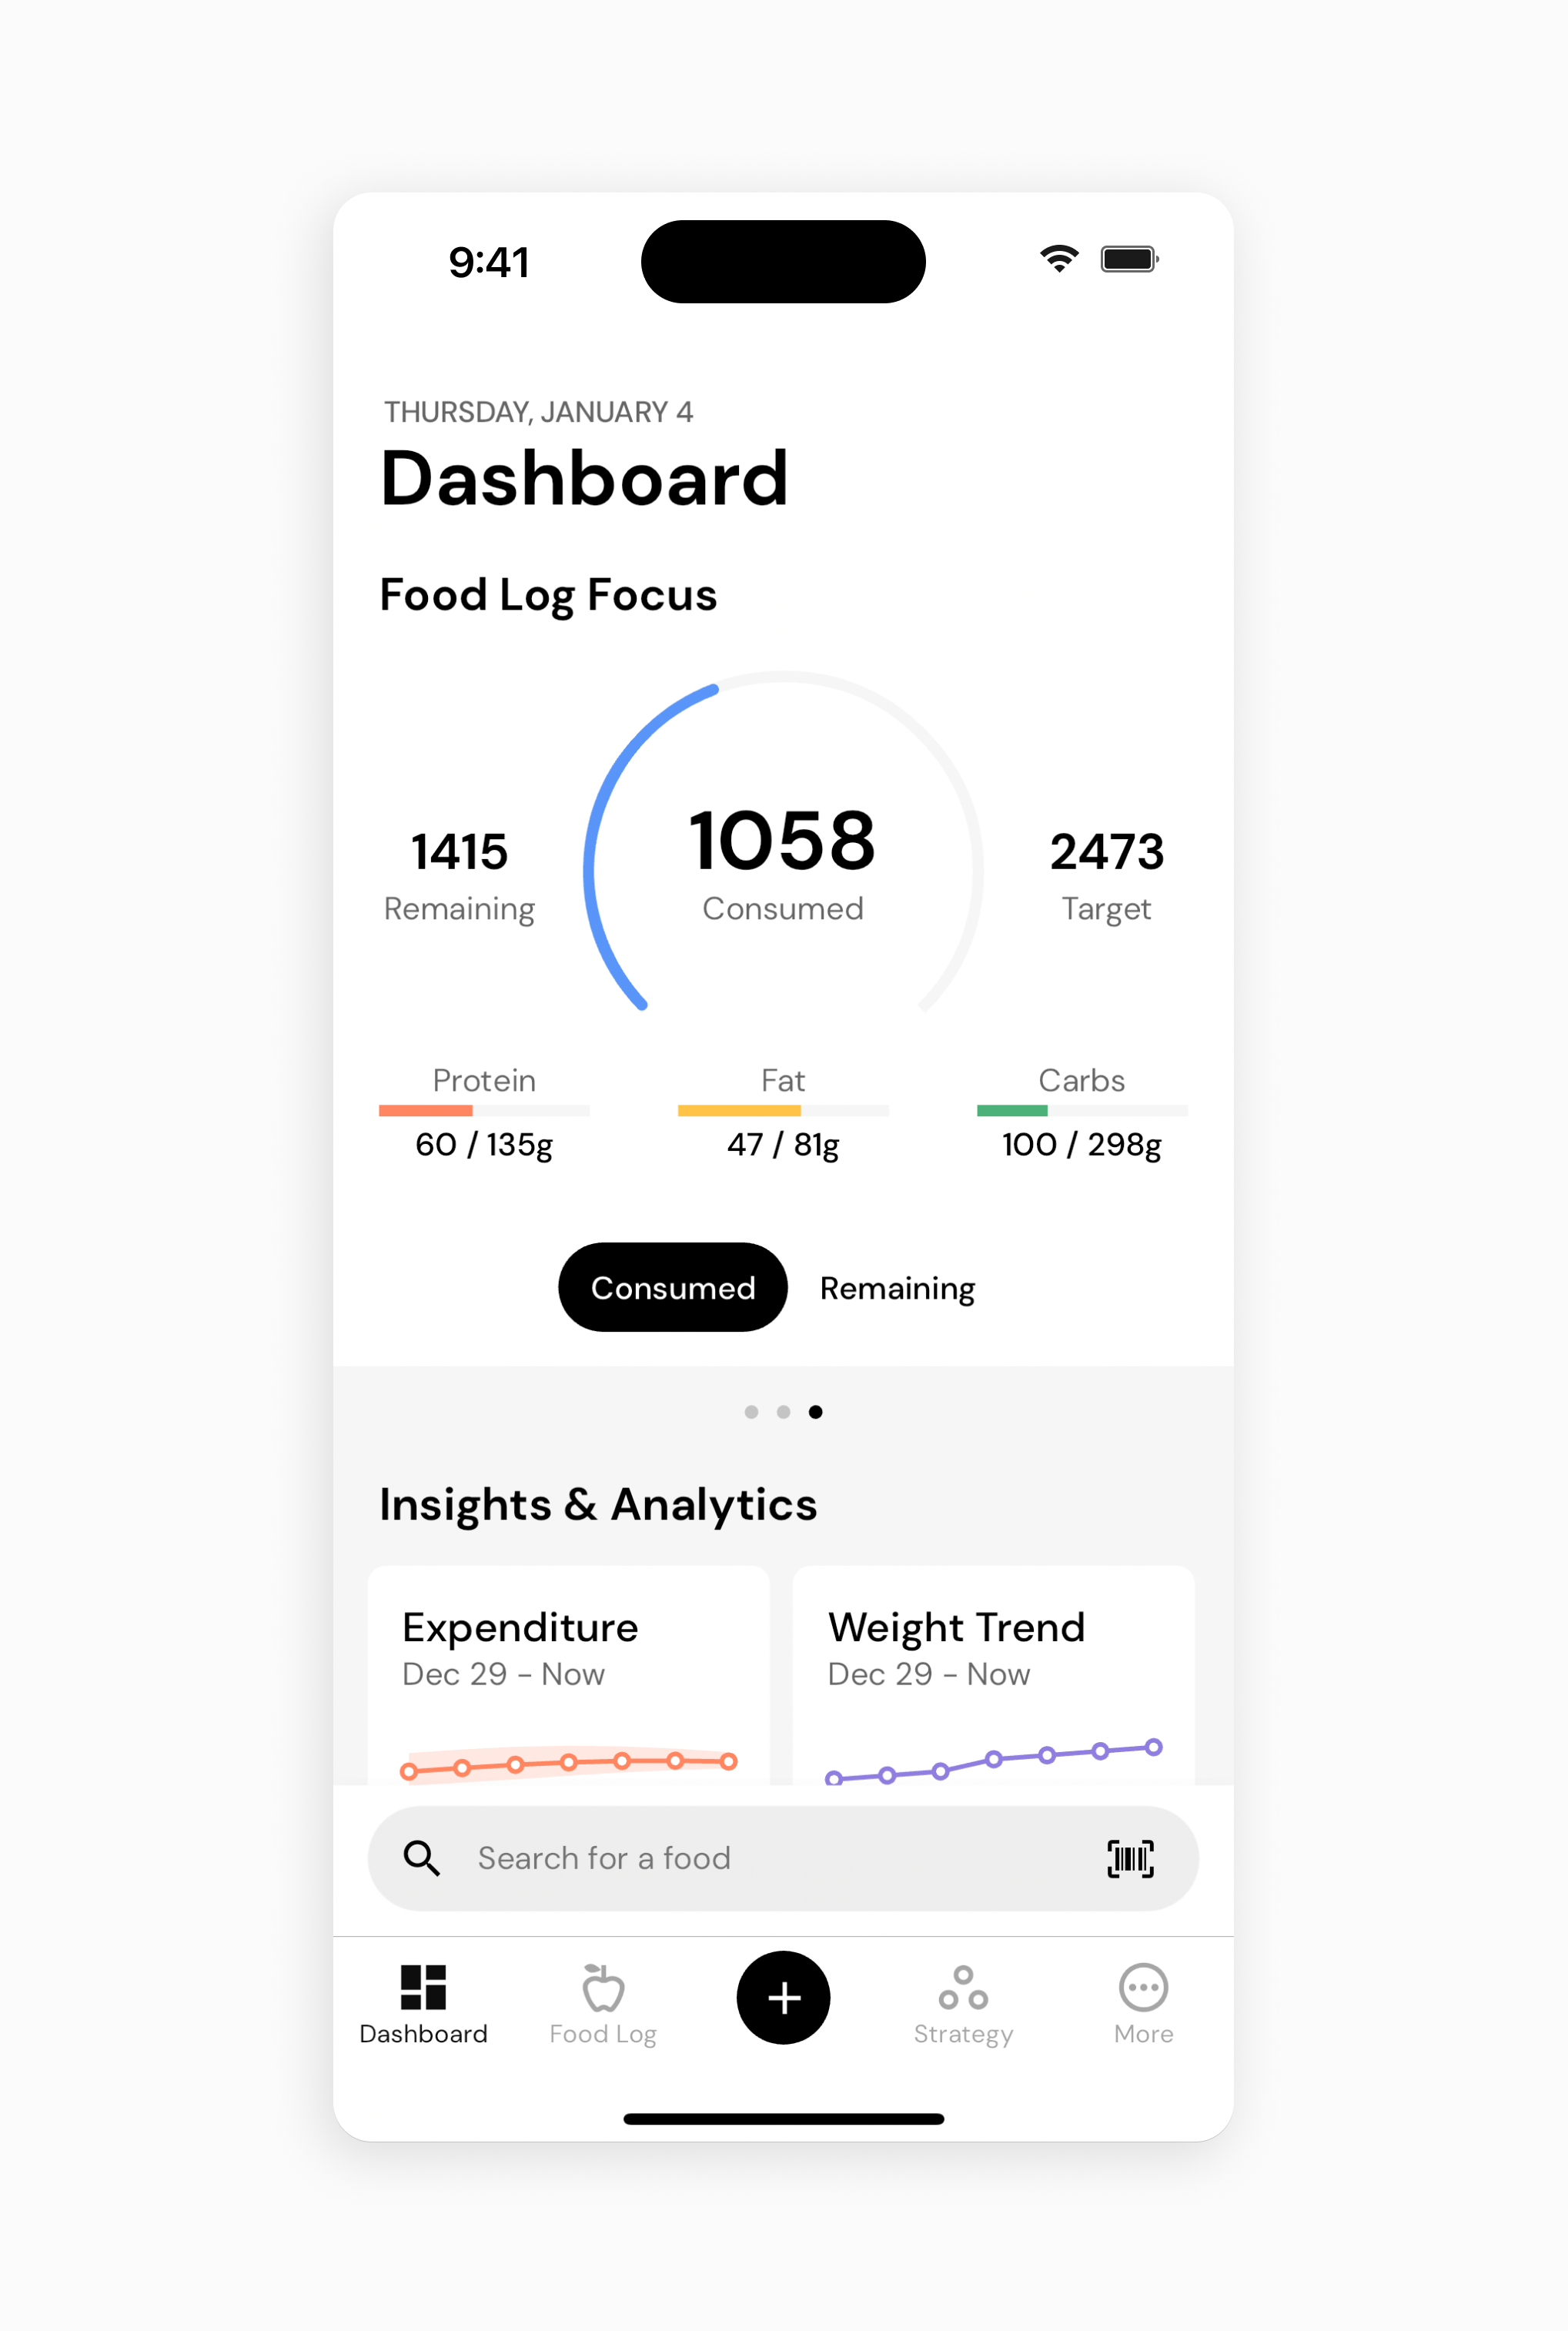
Finally, the "Food Log Focus" view displays your intake and targets for the current day. It doesn't display any information you couldn't get from the "Nutrition & Targets" view, but it gives the information more room to breathe, and displays your daily intake and targets in larger text that's easier to read at a glance.
The next section of the dashboard is the "Insights & Analytics" section. The three widgets in this section – Expenditure, Weight Trend, and Goal Progress – display interpreted information. You can tap on these three widgets to view information that will help you better understand how much energy your body is burning, how quickly your weight is changing, and how you're progressing toward your goal.
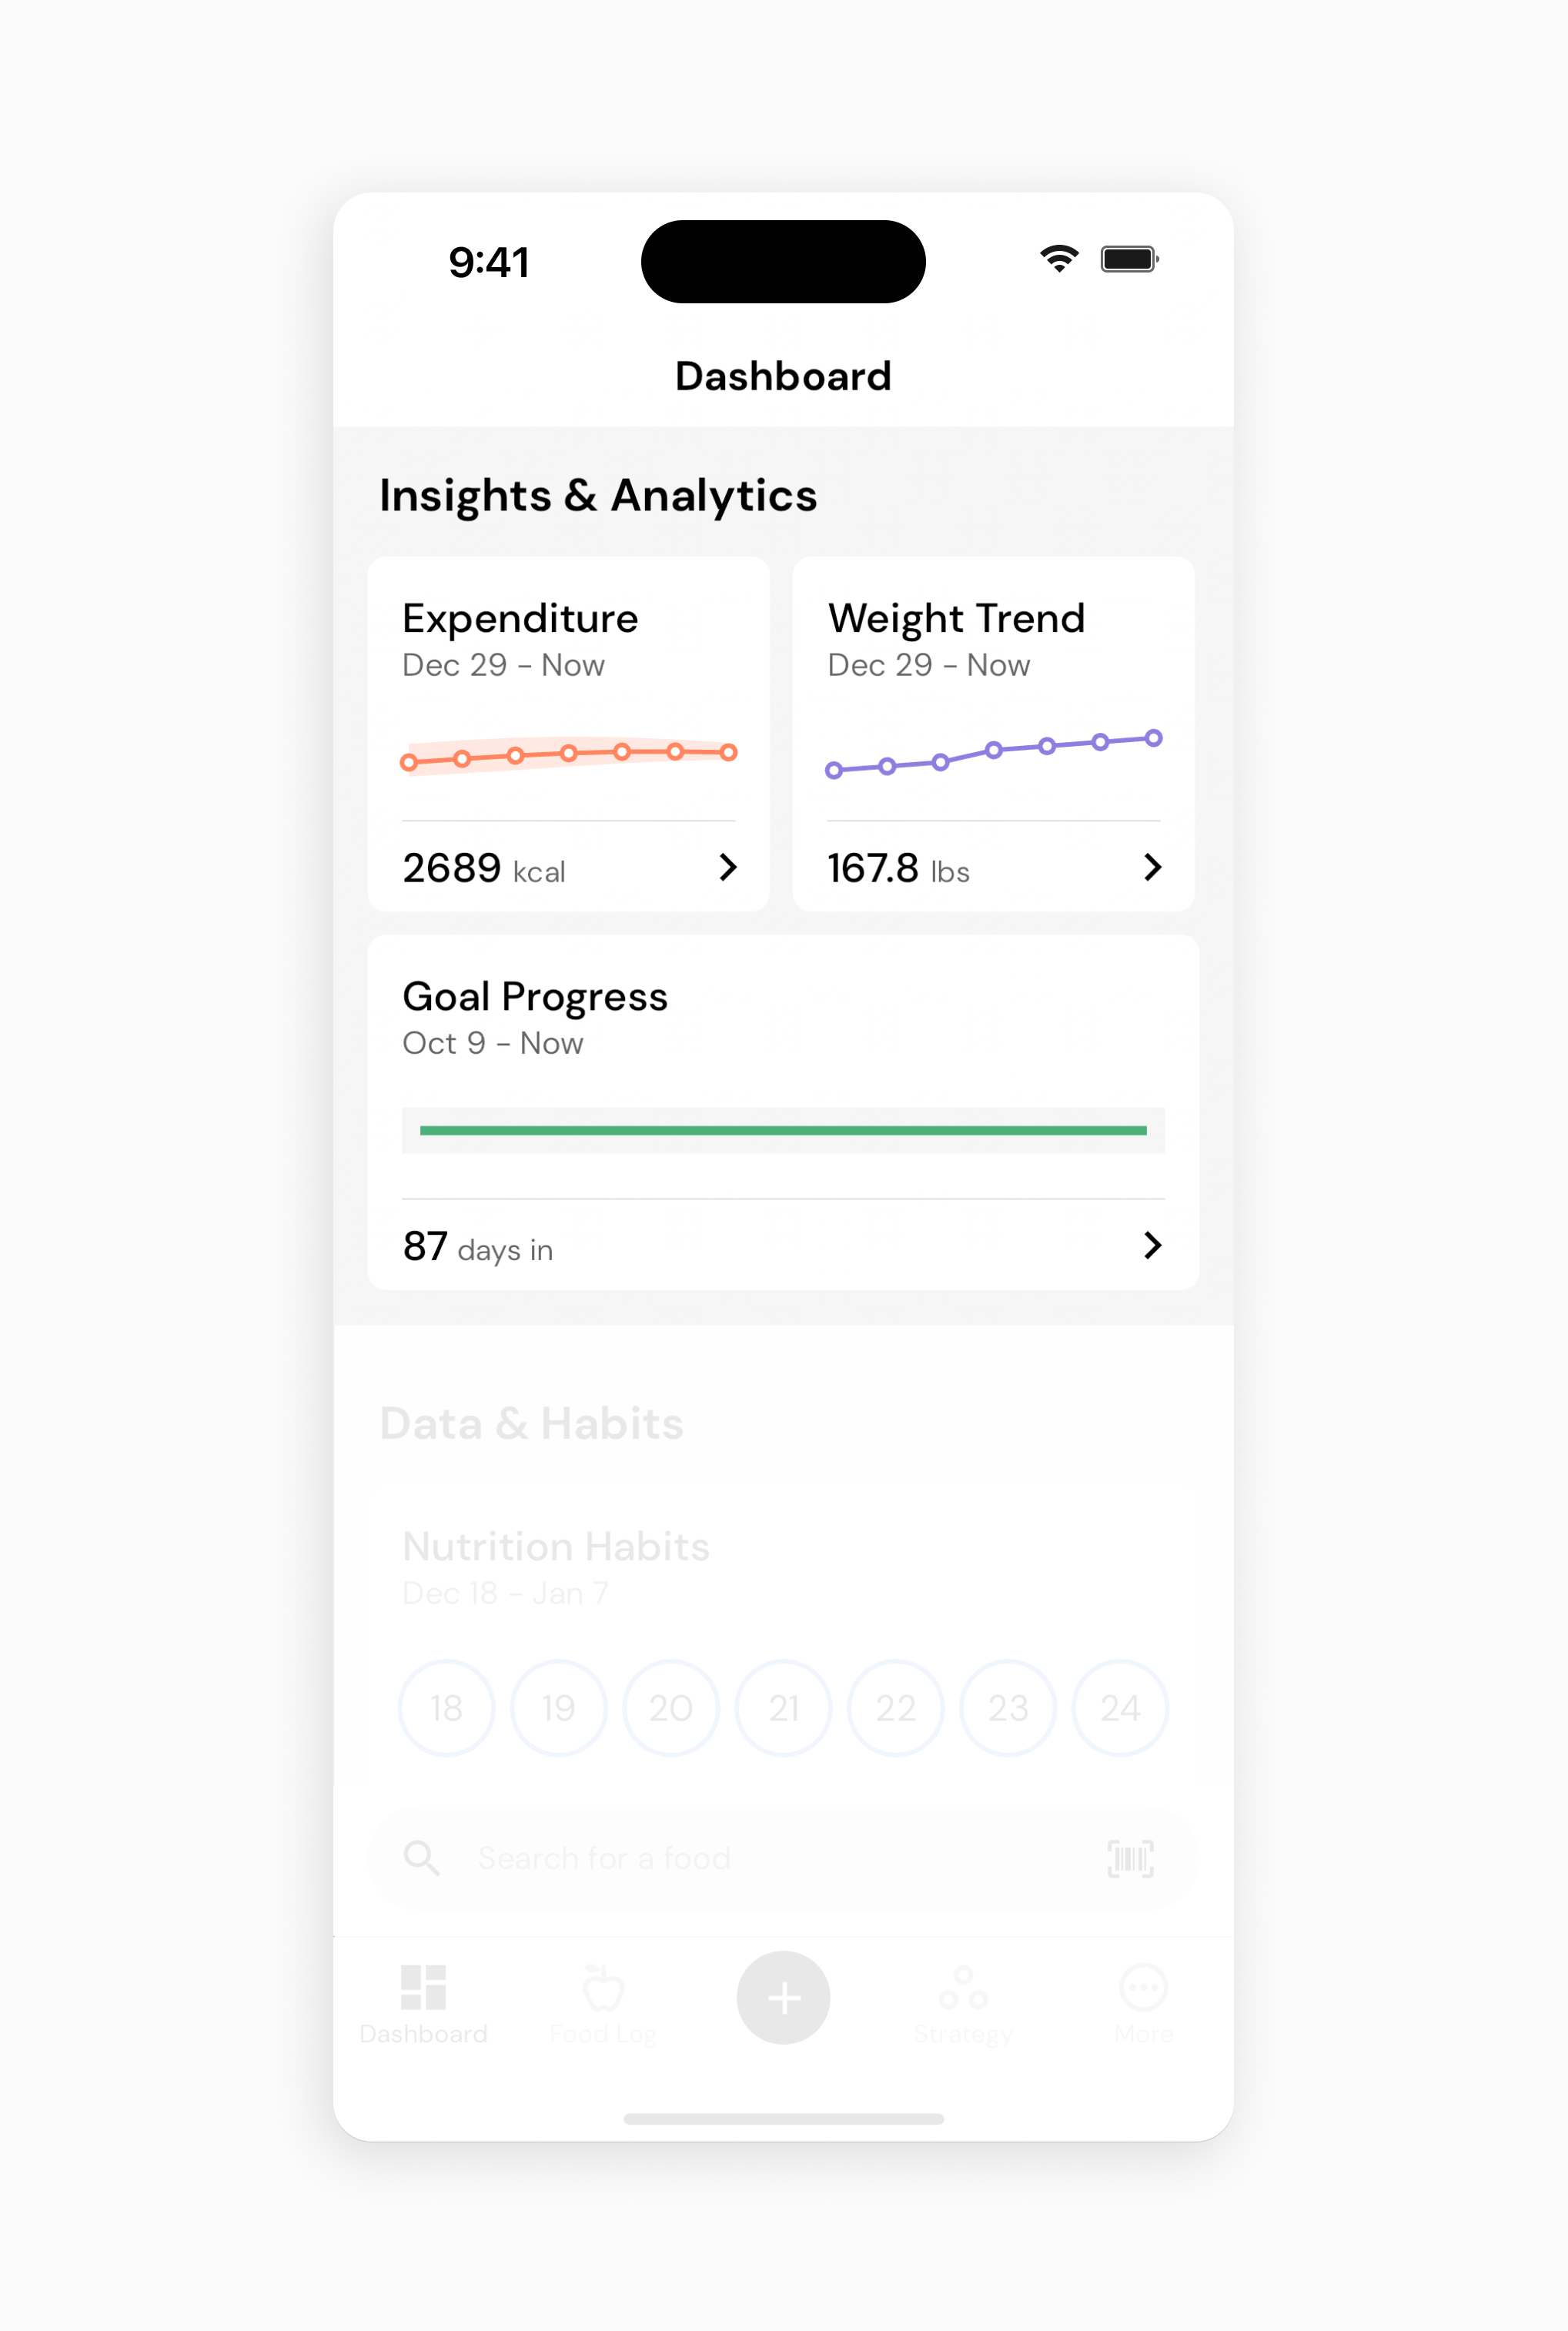
The Expenditure screen displays MacroFactor's estimate of your energy expenditure over time. The initial estimate is based on the information you entered during onboarding (or your own manual initial estimate), and updates are based on your nutrition intake and change in weight. You can use this screen to better understand your energy needs at a single moment in time, or to observe how your energy expenditure changes as you gain or lose weight, or your exercise habits change. You can read more about how MacroFactor estimates your expenditure here.
The Weight Trend screen helps you understand how your weight is changing over time while cutting through the noise of daily weight fluctuations. You can read more about your weight trend here.
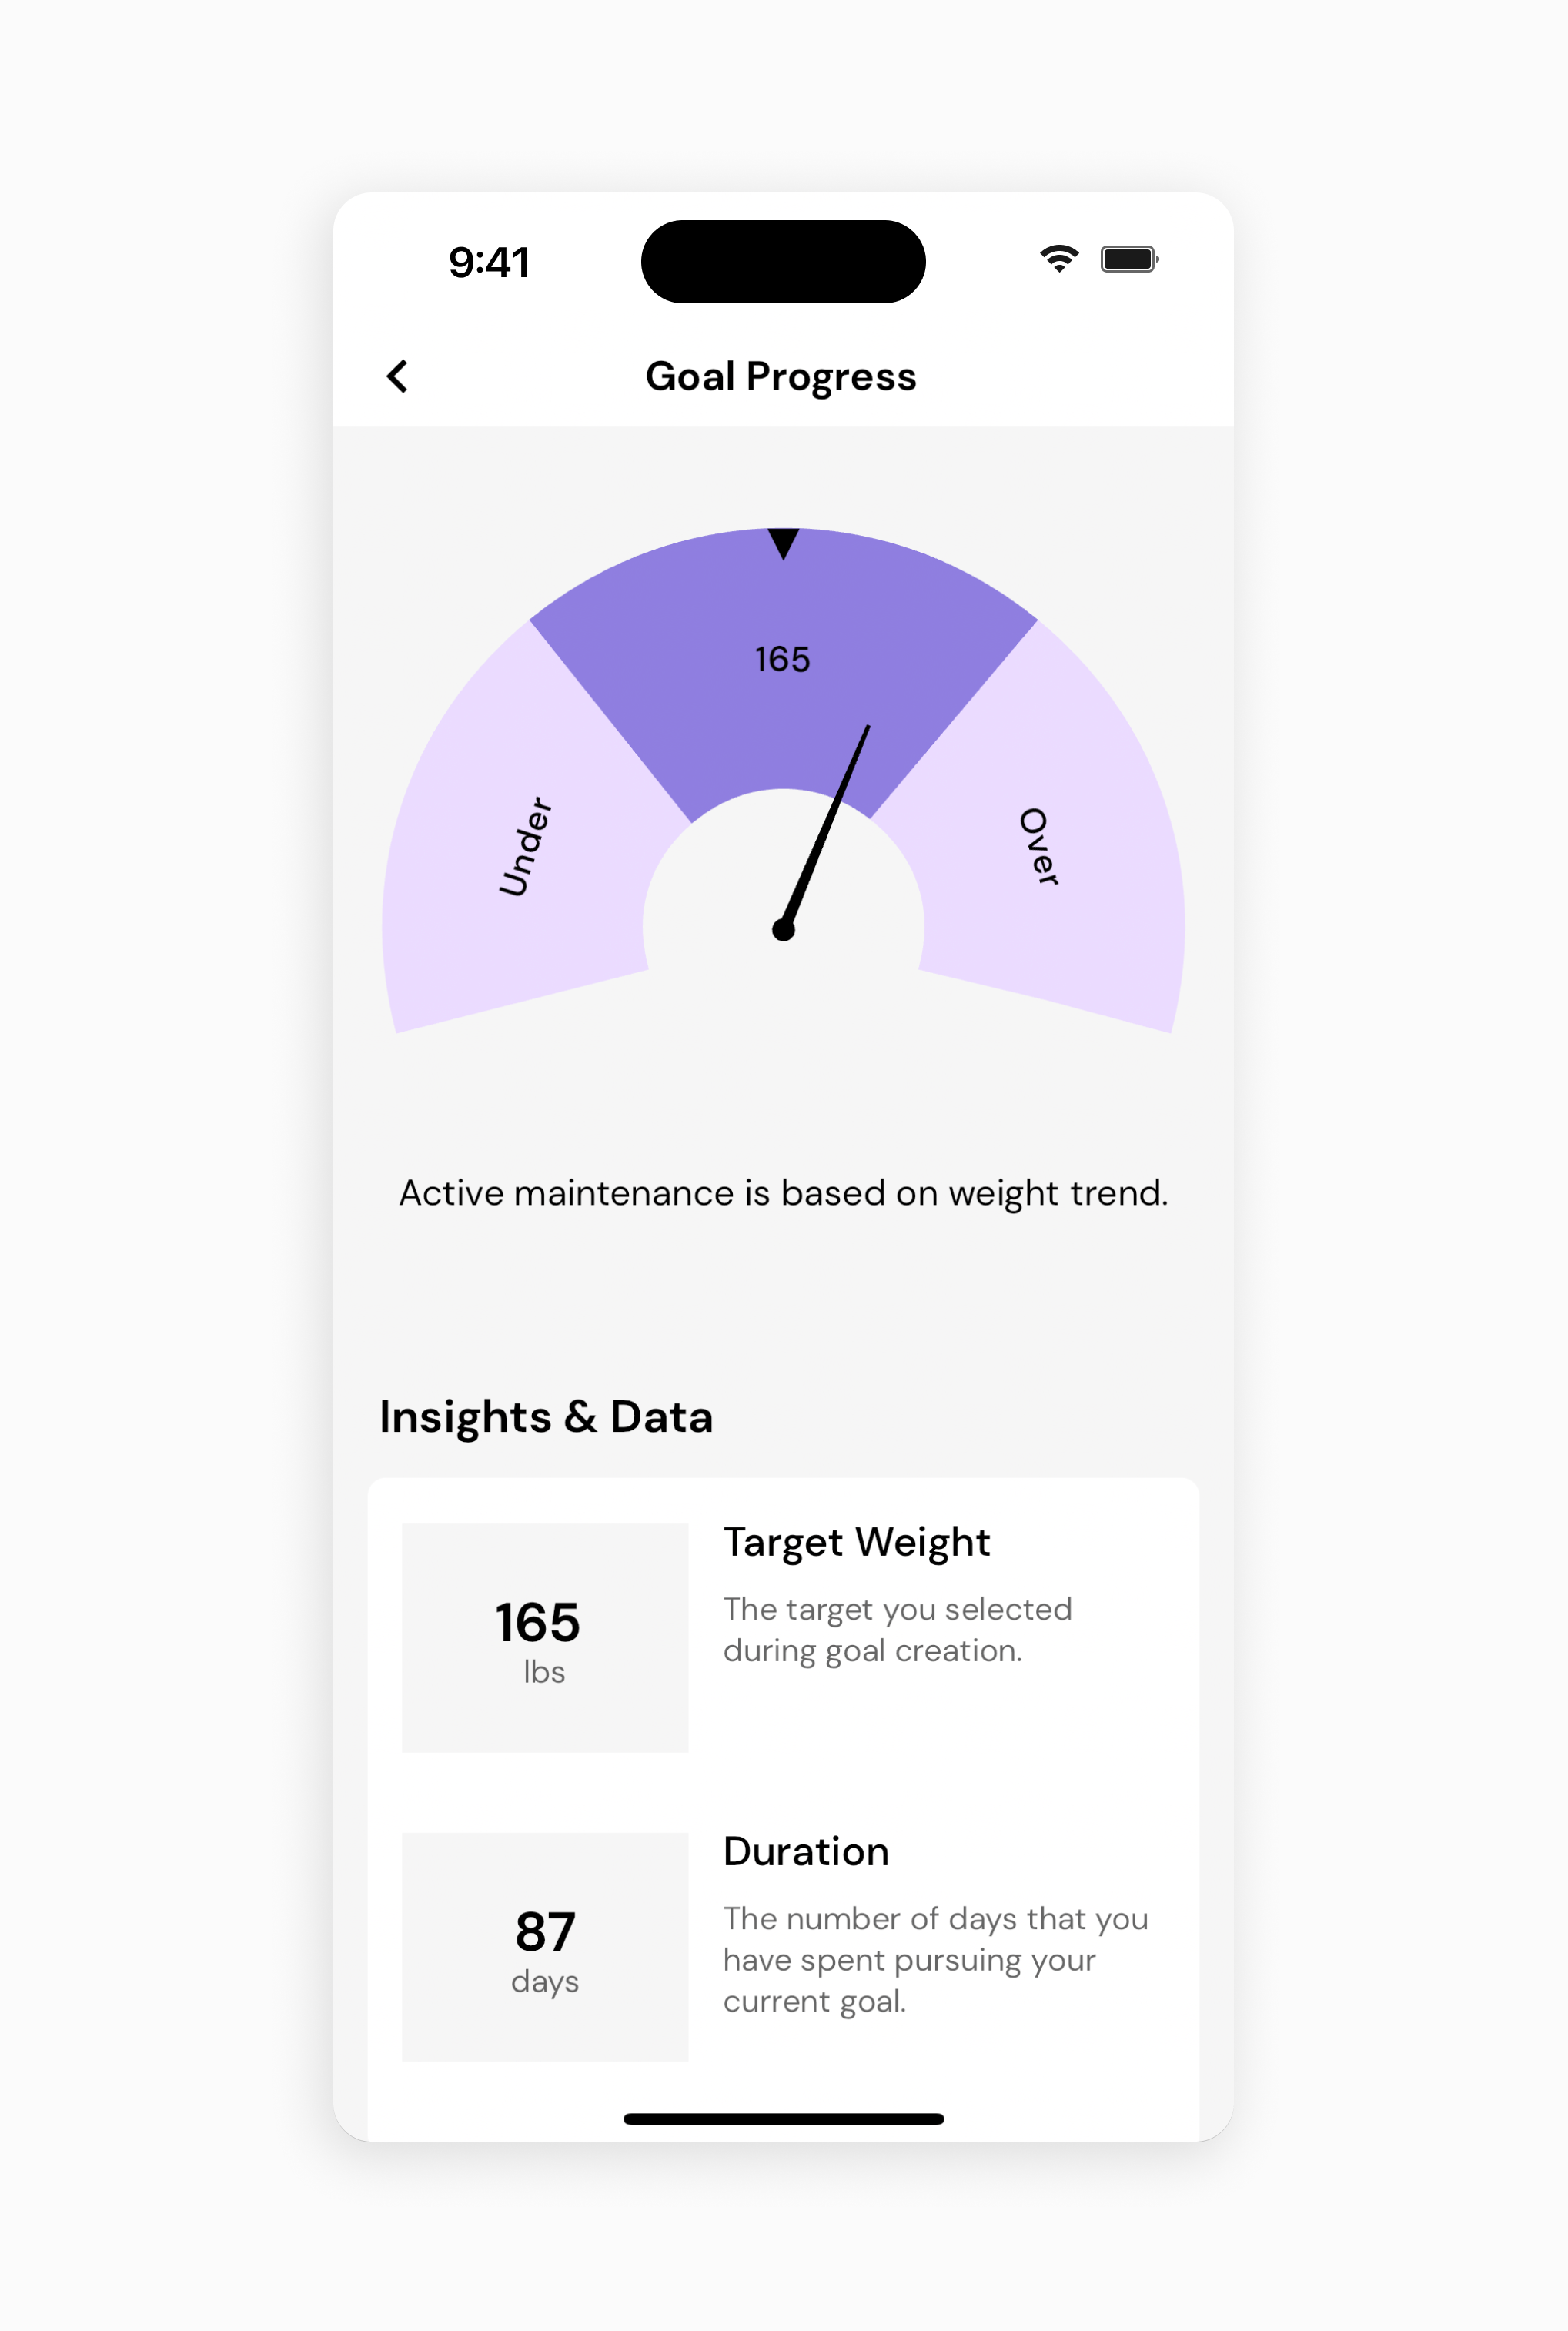
Finally, the Goal Progress screen displays your progress toward your current goal.
If you have a goal of gaining or losing weight, the chart on this screen is a waterfall chart. The bar on "Week 0" shows you the size of your goal. If you have a goal of gaining or losing 10 pounds, the bar will have a height of 10 units on the vertical axis. Each subsequent bar shows you how much progress you made toward your goal each week. Lighter color bars indicate progress toward your goal, and darker color bars indicate that you got a bit further from your goal. Finally, the gray bar on the right side of the chart shows how close you are to completing your goal. If you had a goal of losing 10 pounds, and you've already lost 6 pounds, this bar would be four units high on the vertical axis. So, altogether, this chart shows you the size of your initial goal, how close you are to completing your goal, and your week-to-week progress.
If you have a goal of maintaining your weight, the chart on this screen will look like a dial, with the weight you'd like to maintain in the middle of the dial. If your trend weight gets more than 1.5 pounds (0.68 kilograms) below the weight you'd like to maintain, the dial will tick over into the "Under" section of the dial. If it gets more than 1.5 pounds (0.68 kilograms) above the weight you'd like to maintain, the dial will tick over into the "Over" section of the dial. If this occurs, and you're on a Coached or Collaborative macro program, MacroFactor's coaching algorithms will recommend a small energy surplus or deficit (0.15% of body weight per week) to nudge you back toward the weight you'd like to maintain.
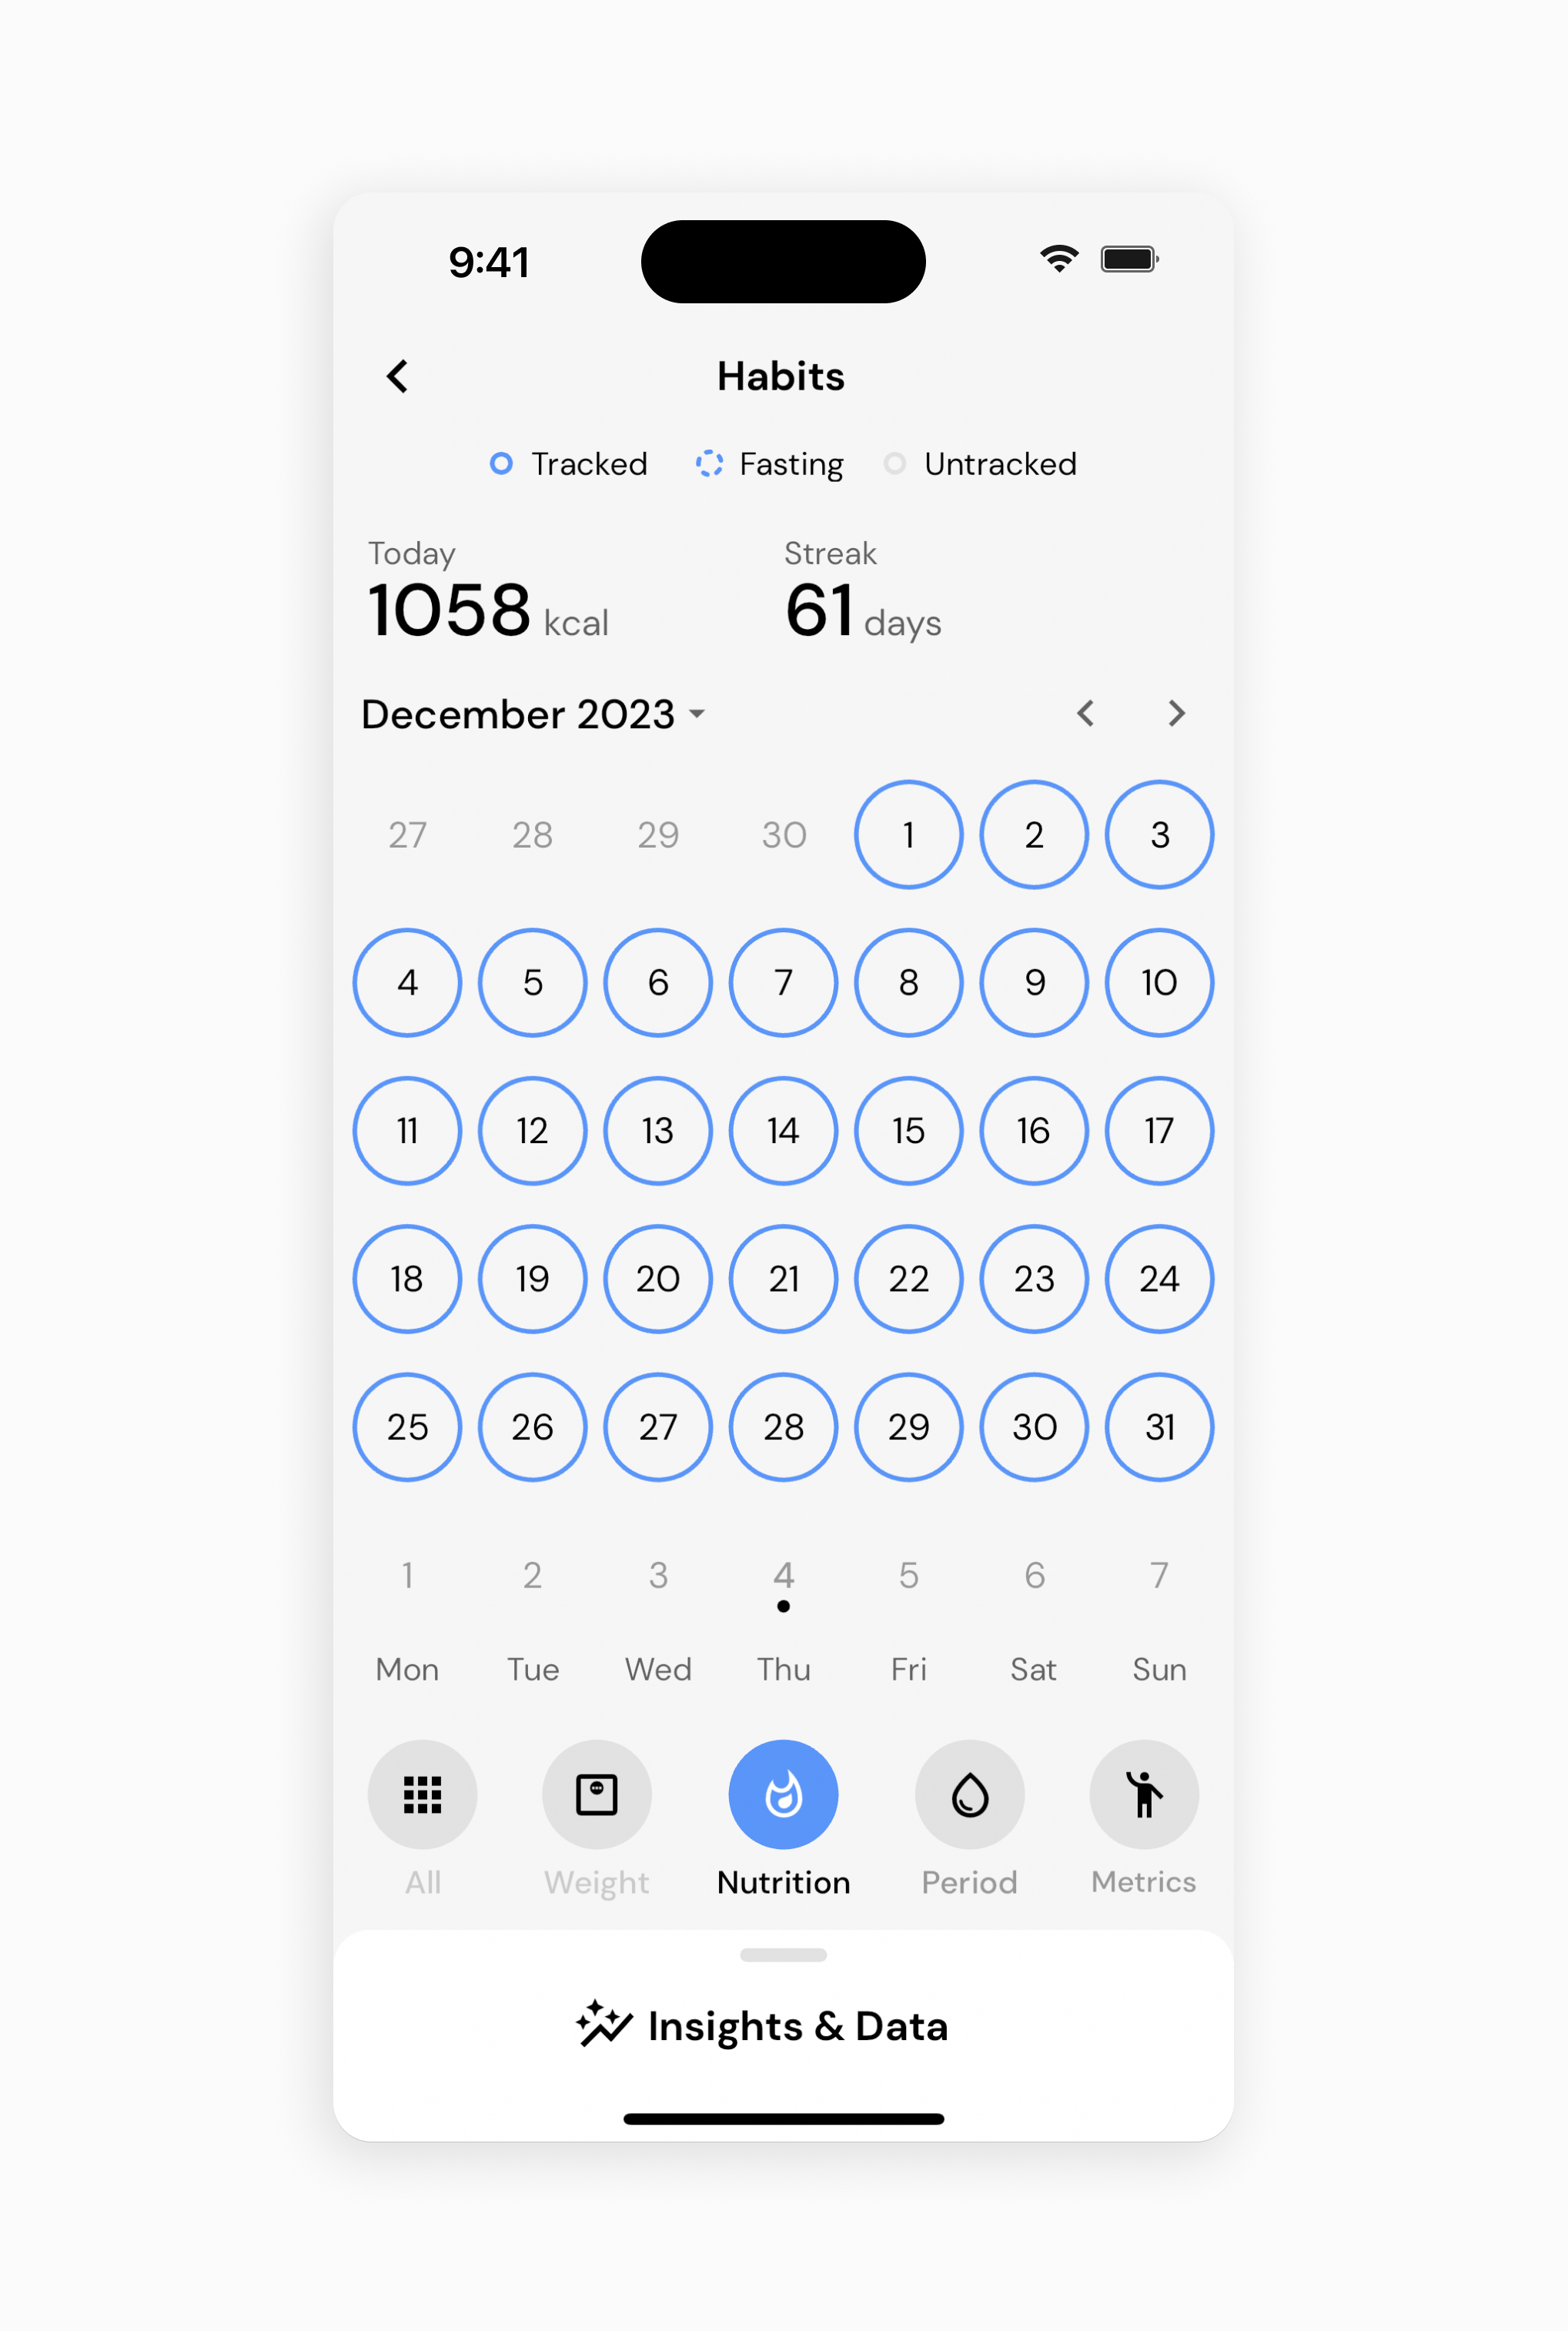
The Habits section shows you your consistency with nutrition and weight tracking. When you tap on this widget, you can view your logging habits over time. You can also tap on any day to enter new information, or edit information you previously entered on that day.
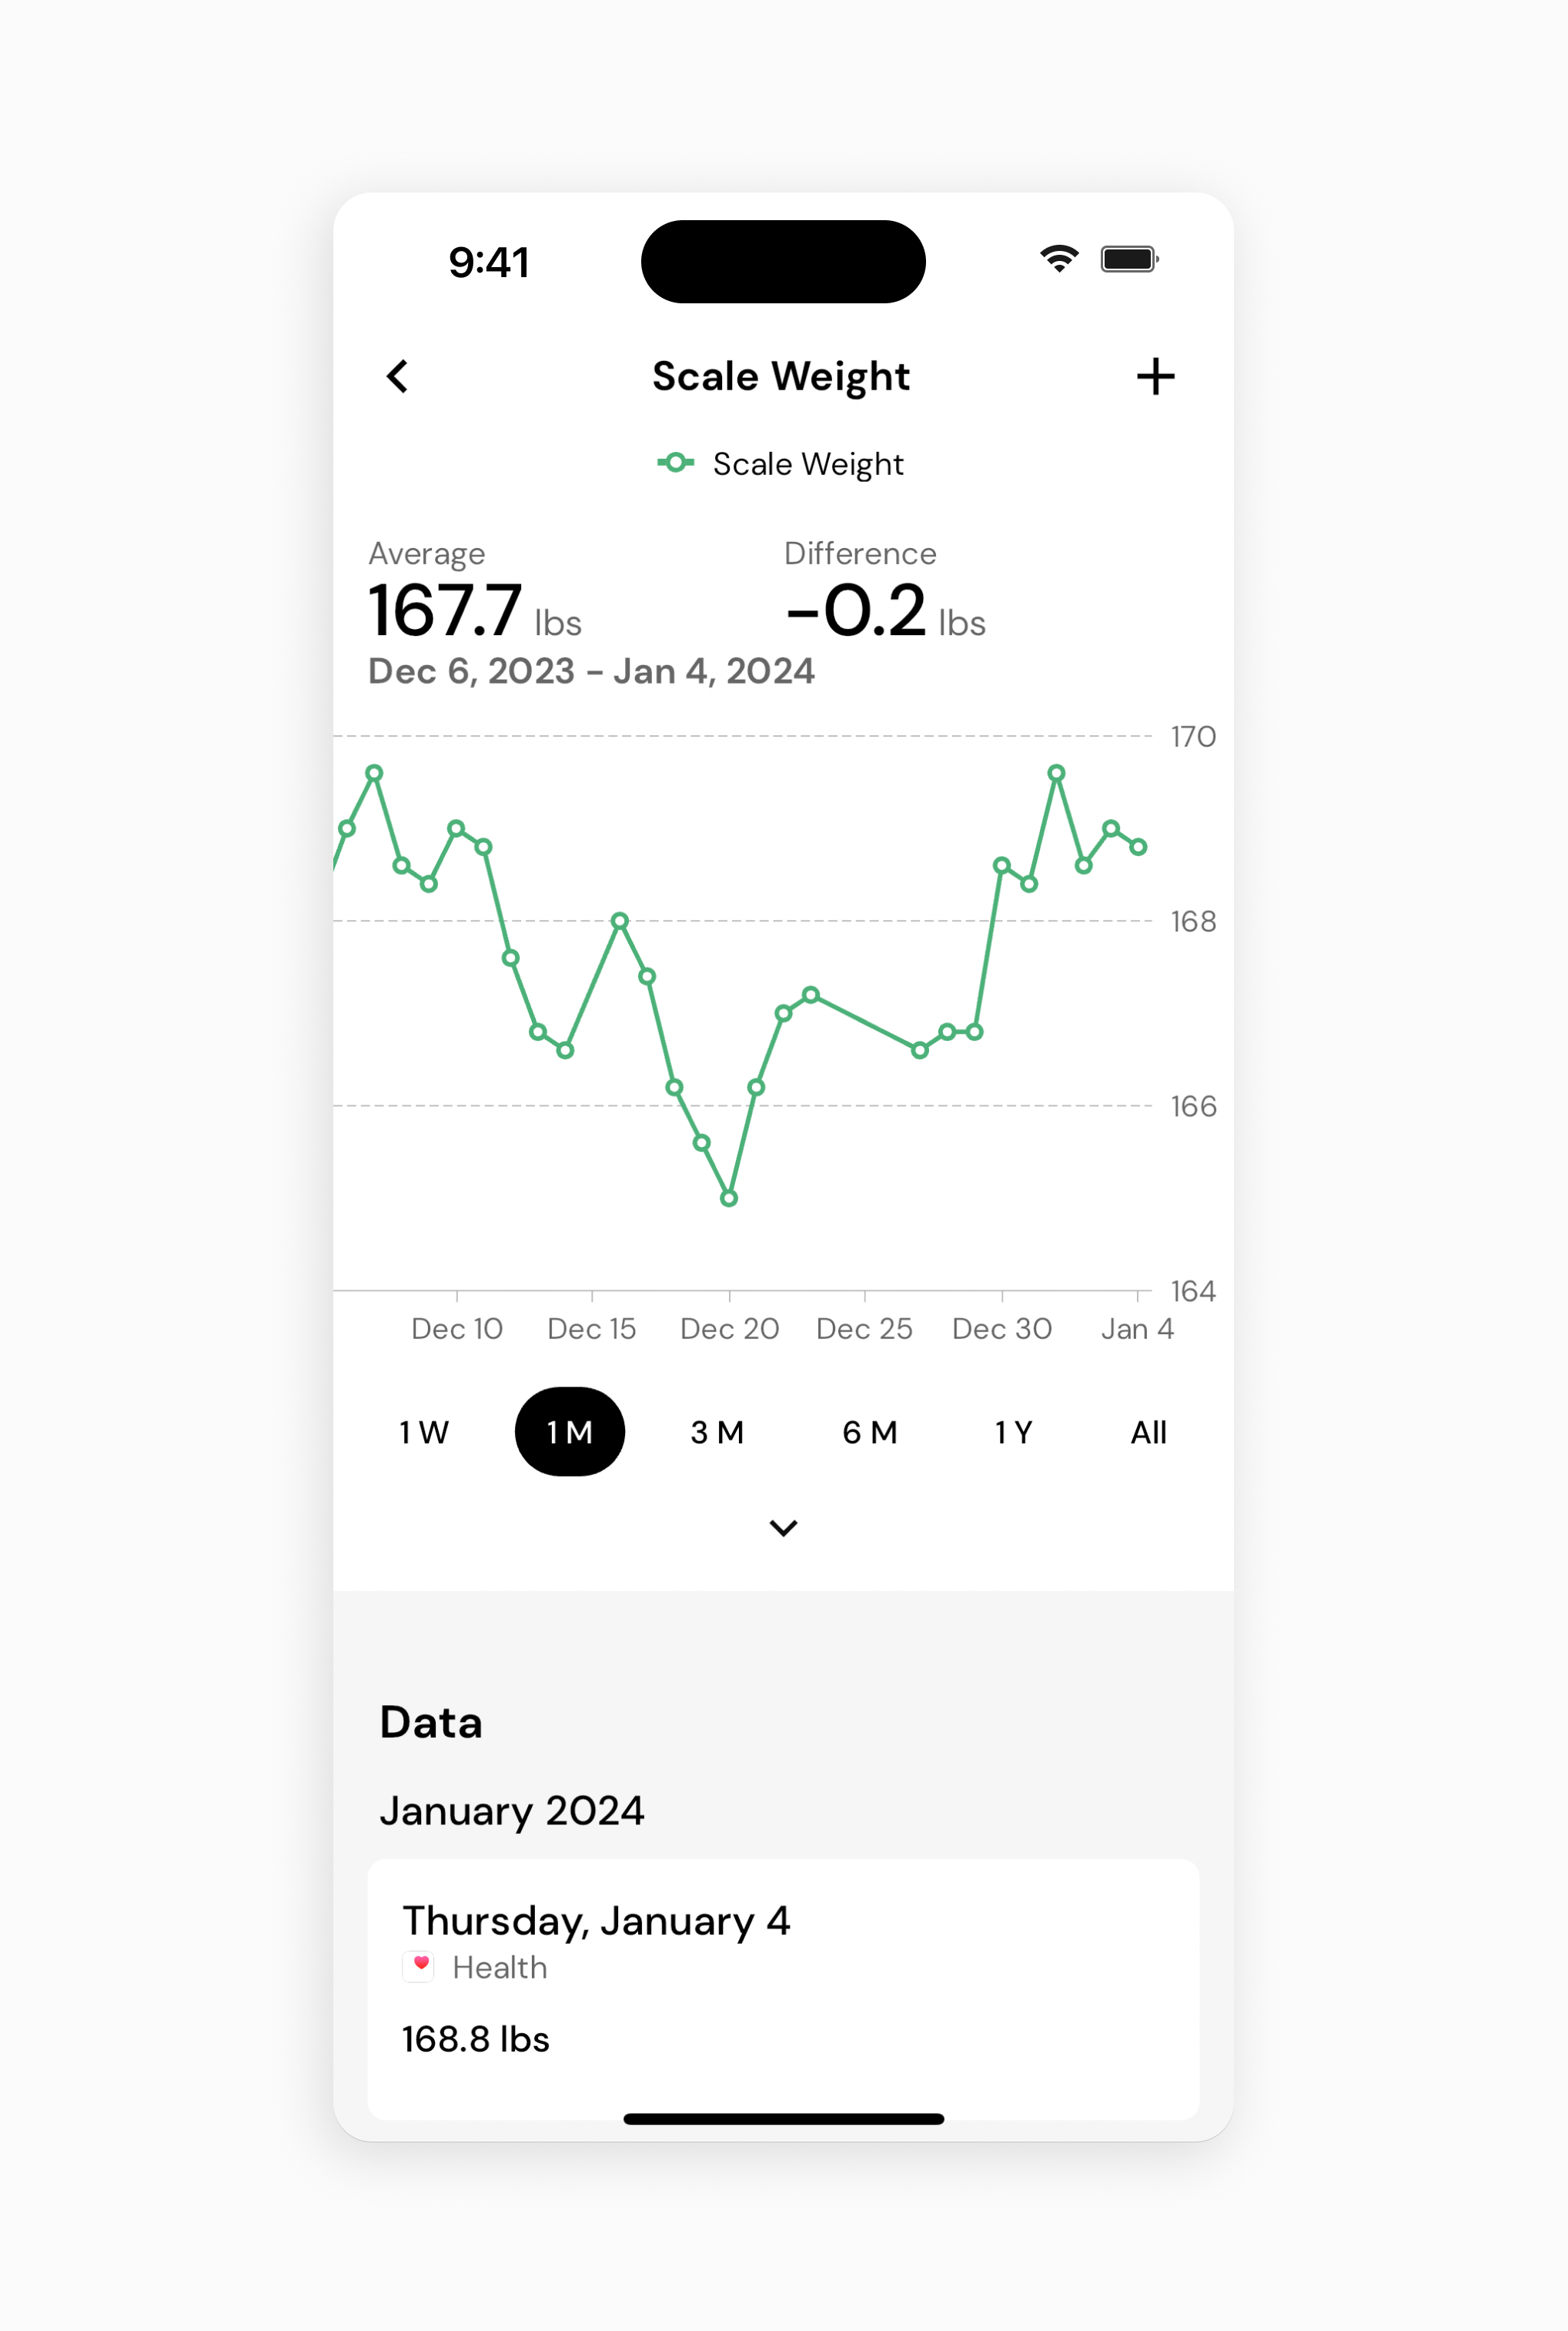
The Scale Weight widget displays your scale weight for the current day, and a line graph indicating your scale weights for the past week. When you tap on this widget, you can view a graph of your scale weight over time, add new weight entries, or edit prior weight entries.
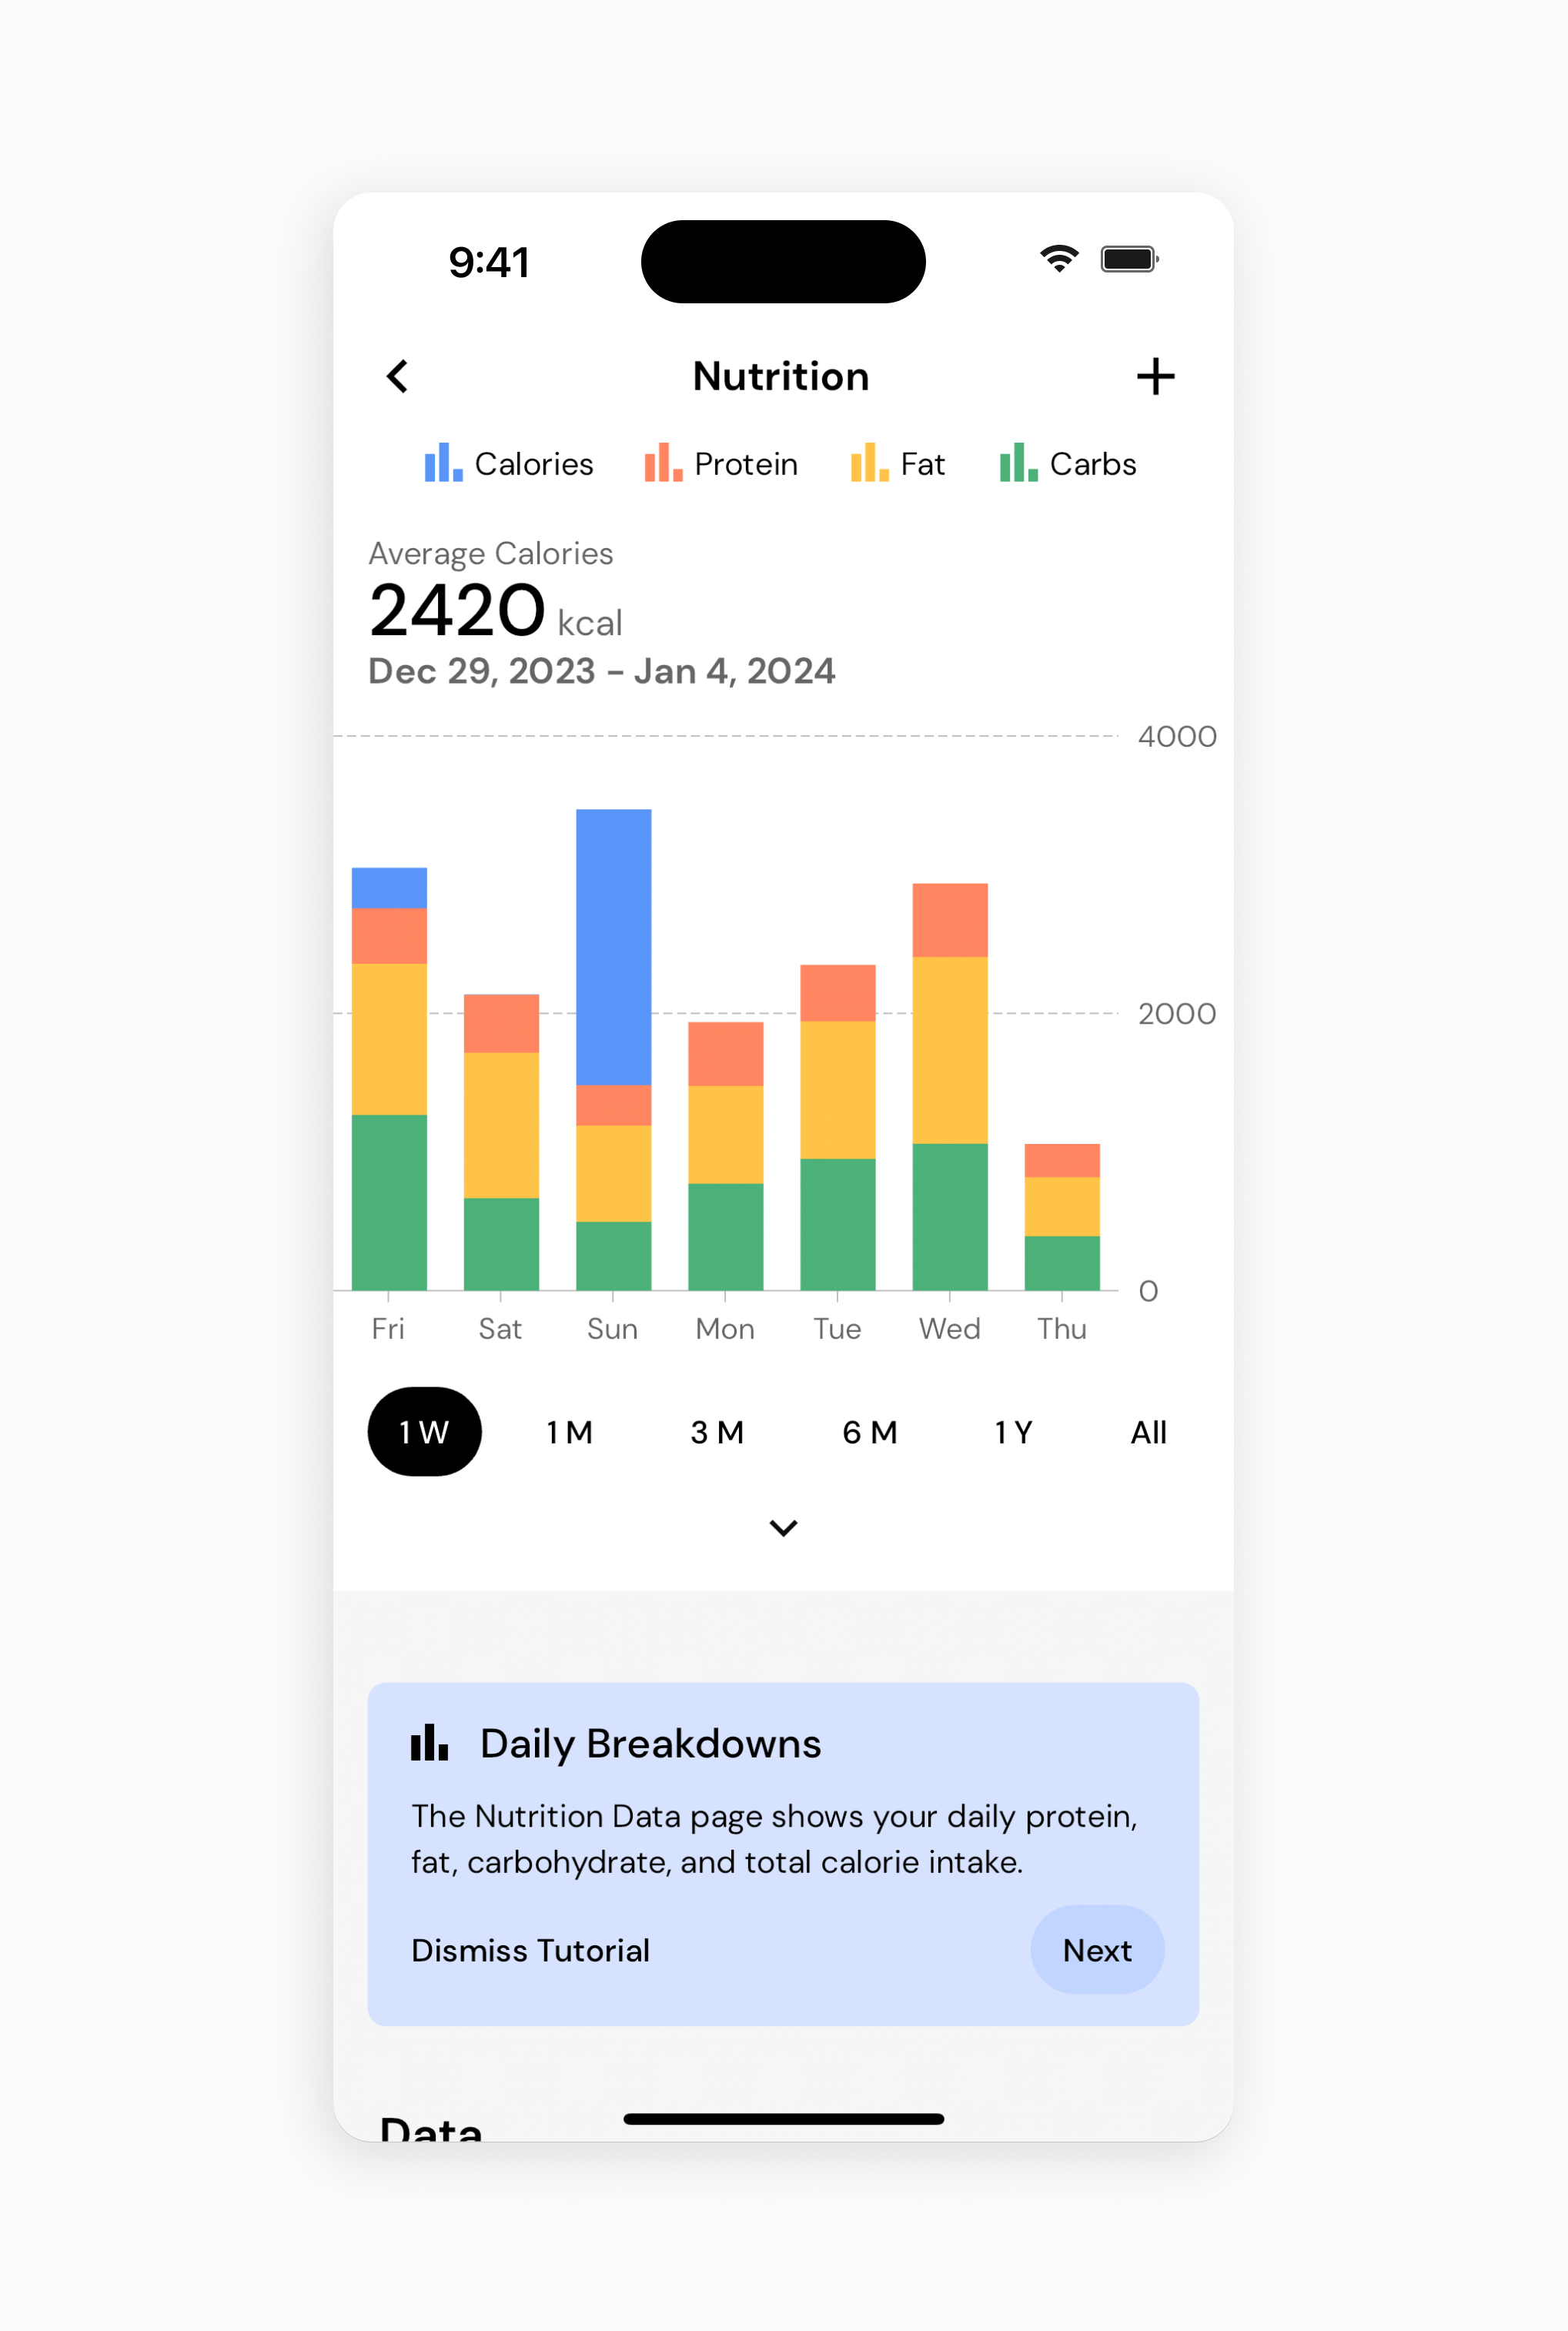
The Nutrition widget displays your calorie intake for the day, along with stacked bar graphs indicating your calorie and macronutrient intake for the past week. When you tap on this widget, you can view a graph of your calorie and macronutrient intake over time, add new manual nutrition entries, or edit prior nutrition entries (Note: This will override whatever you logged for the day. See the knowledge base article on source priority to learn more).
The Body Metrics widget allows you to track, monitor, and visualize changes to Scale Weigh, 24 different body measurements, and progress photos from three different angles. You can read more about body metric and progress photo tracking here.
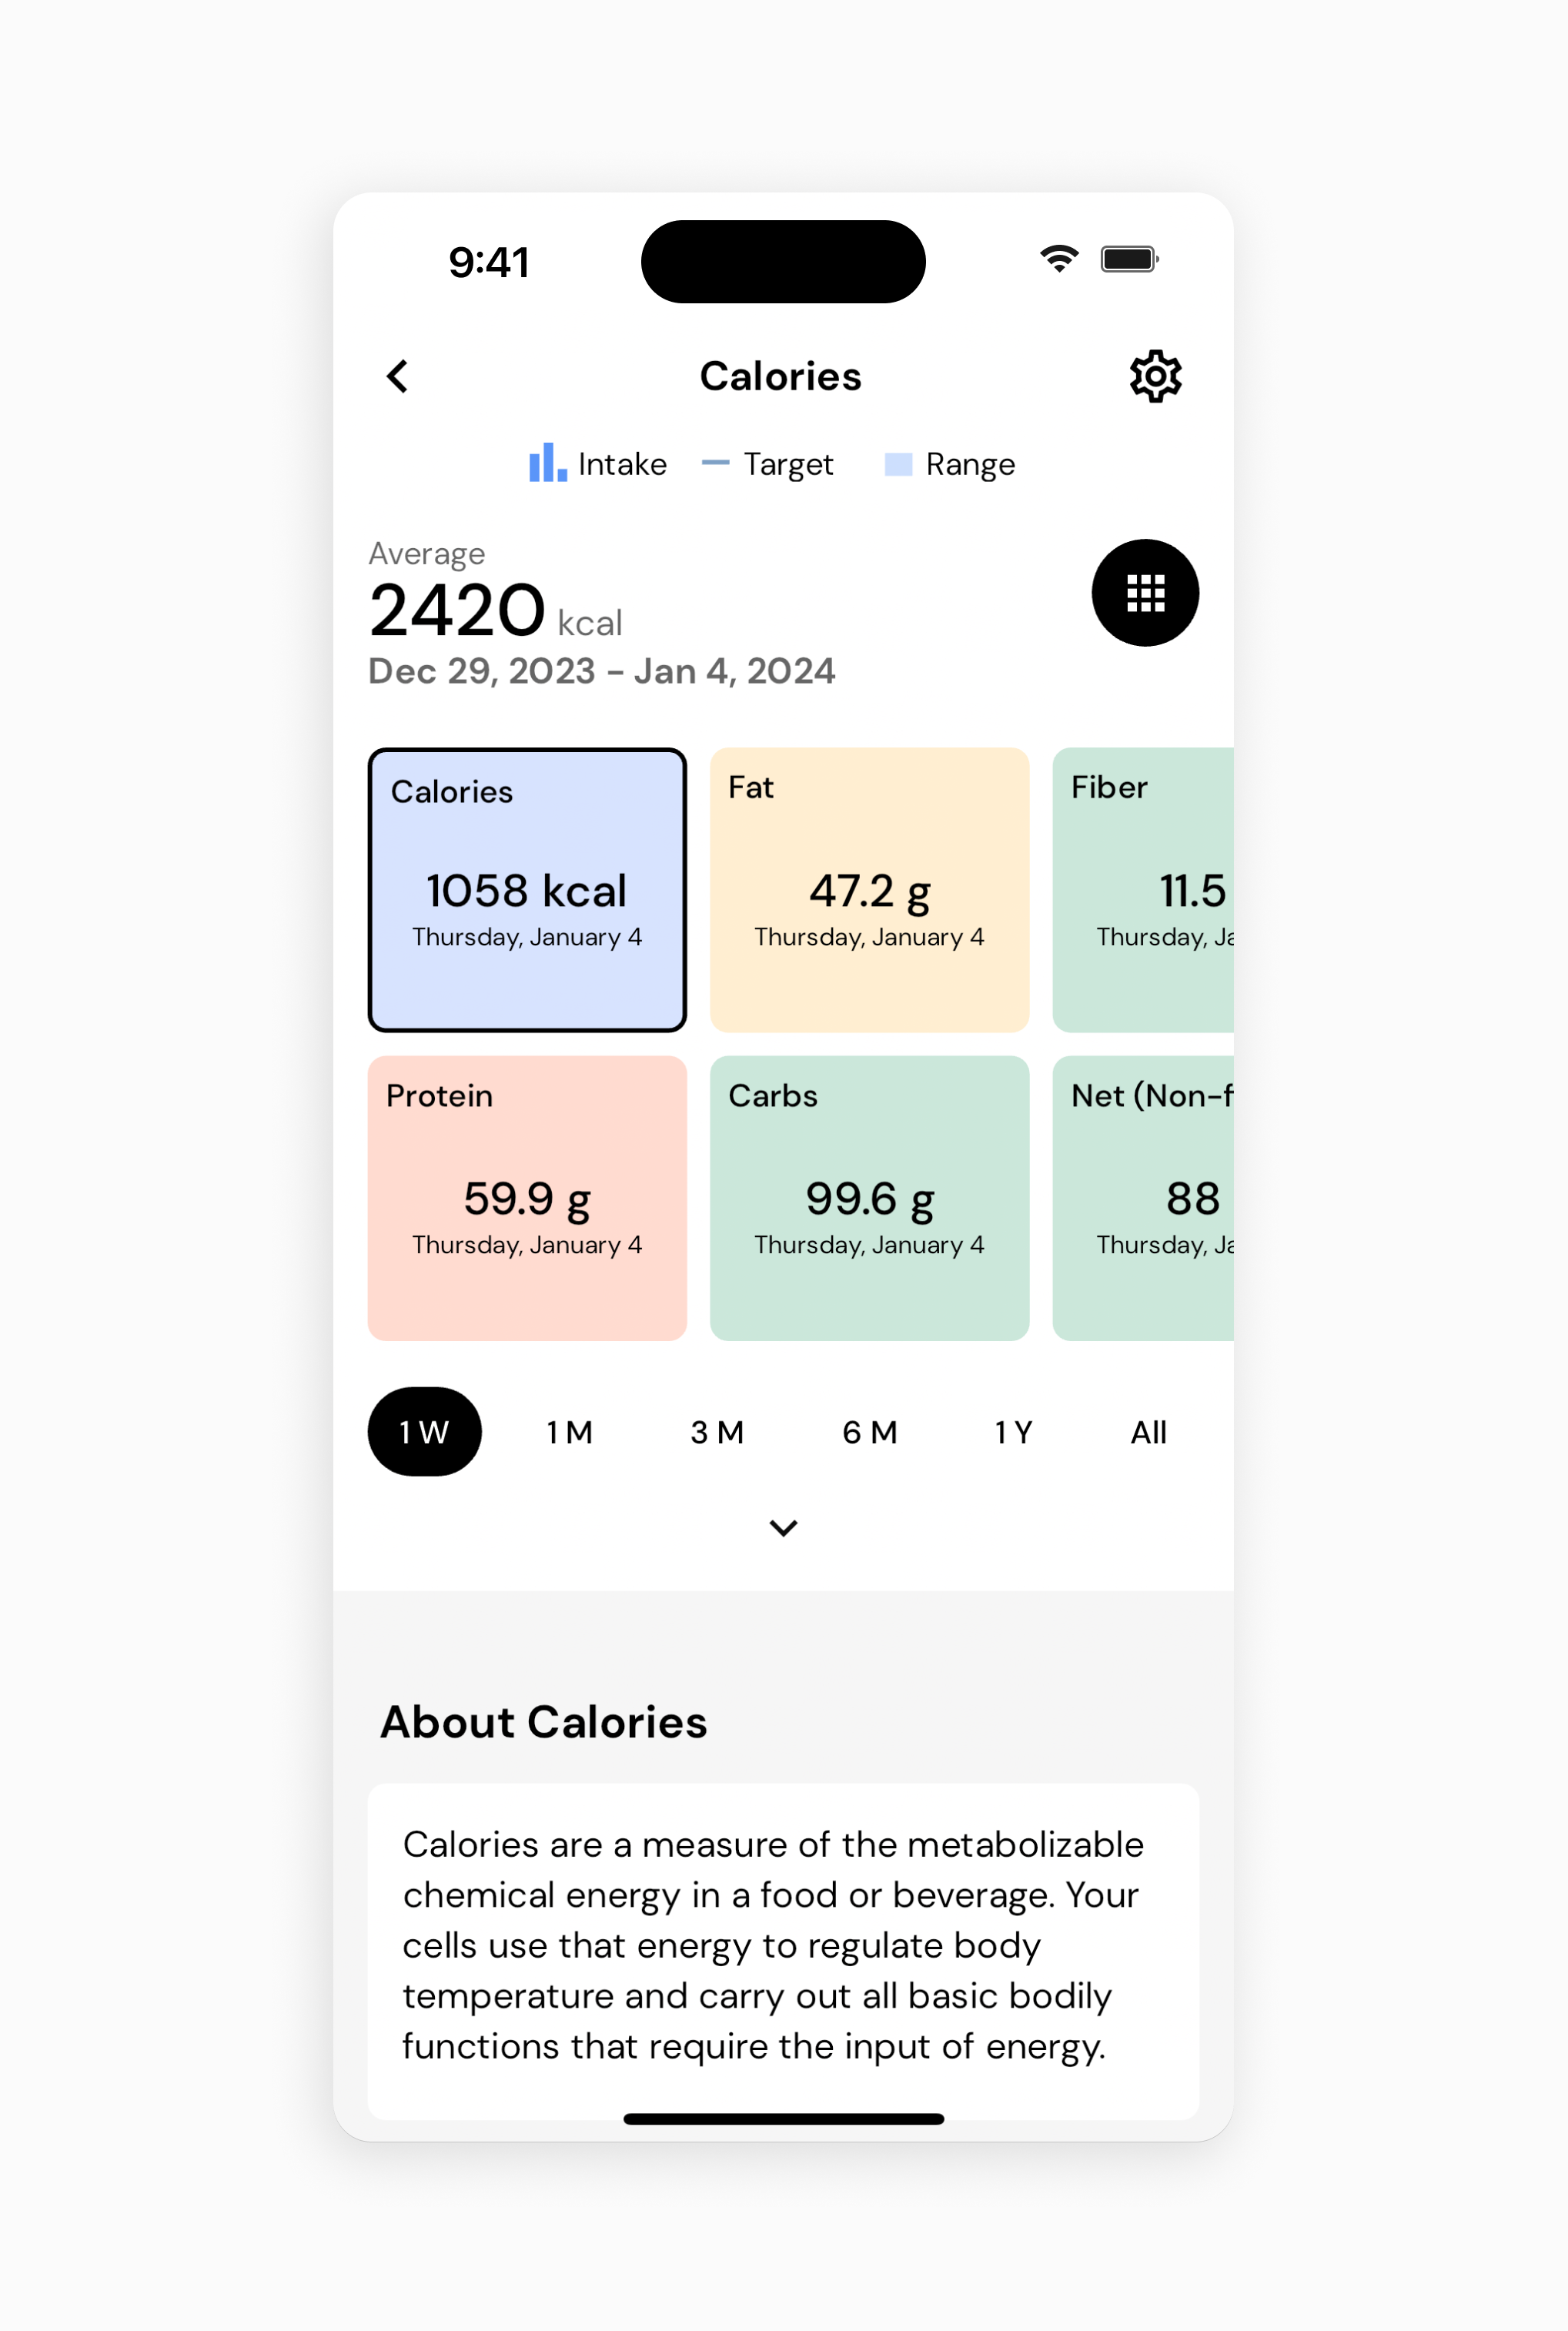
Finally, the Nutrition section of your dashboard lets you monitor your intake of all of the nearly 60 nutrients you can track in MacroFactor, specify the nutrients you’d like to pay closer attention to, see your top food sources of each nutrient, and customize your own nutrient targets. You can read more about the Nutrition Section here.
Now that you’ve learned your dashboard, you might enjoy one of these articles next:
Understanding the Widgets at the Top of the Dashboard
How to Customize your Dashboard
Pin Nutrients to the Dashboard